- Home >
- Stock Photos >
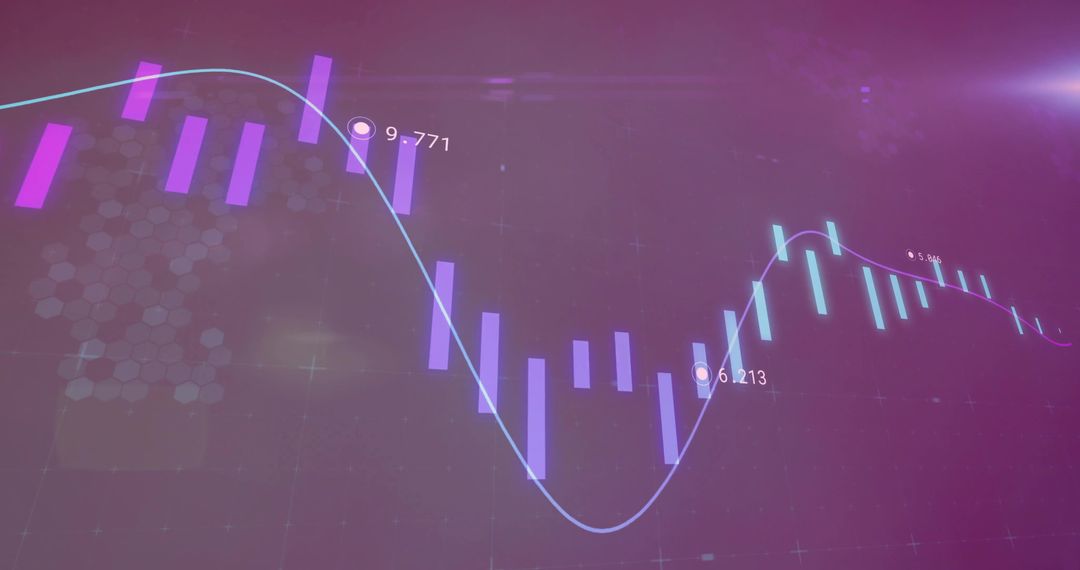
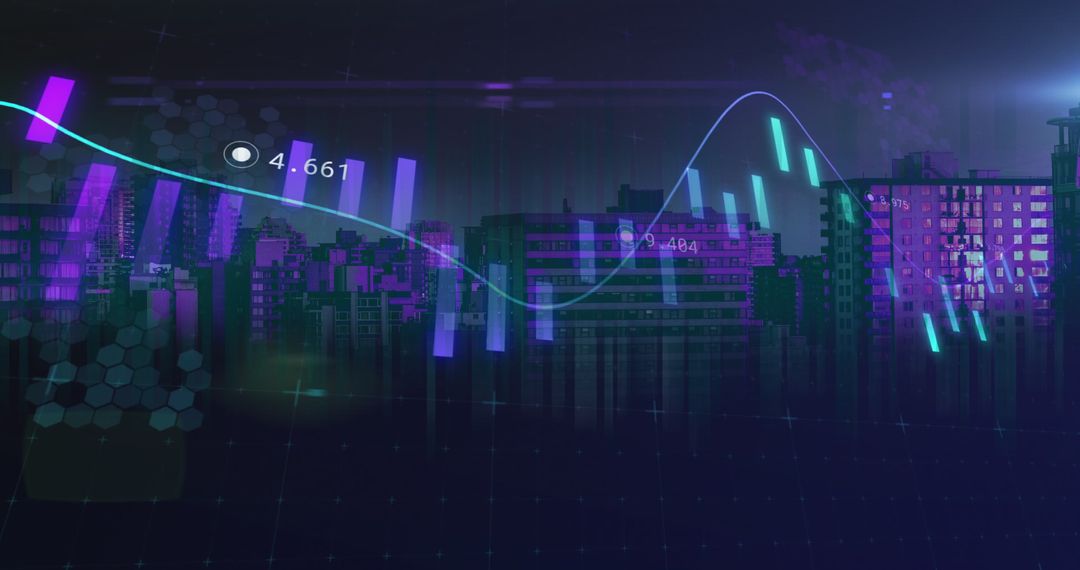
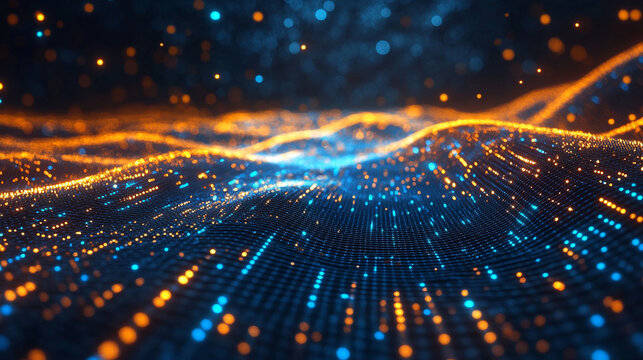
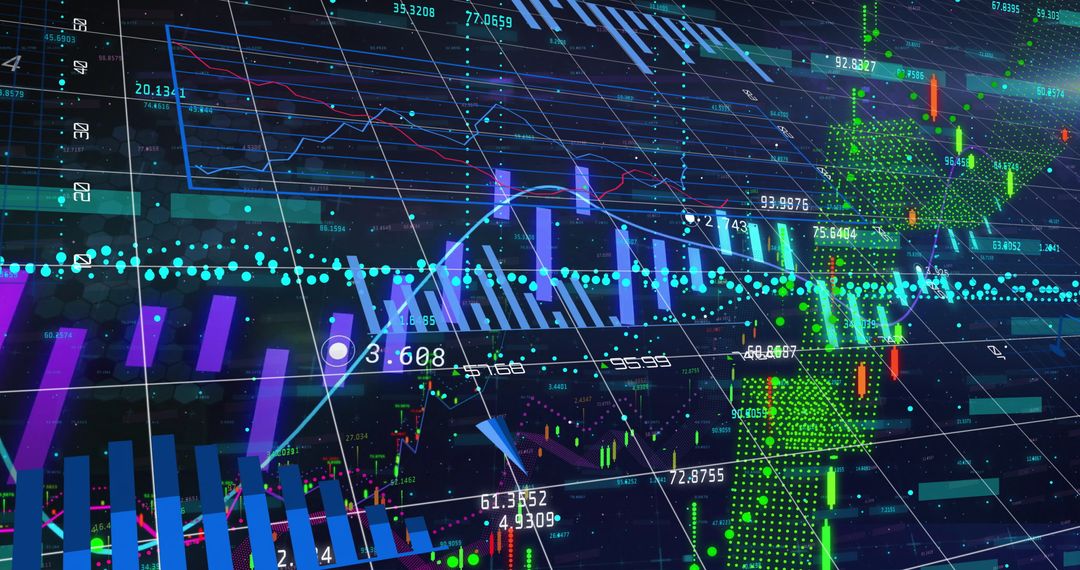
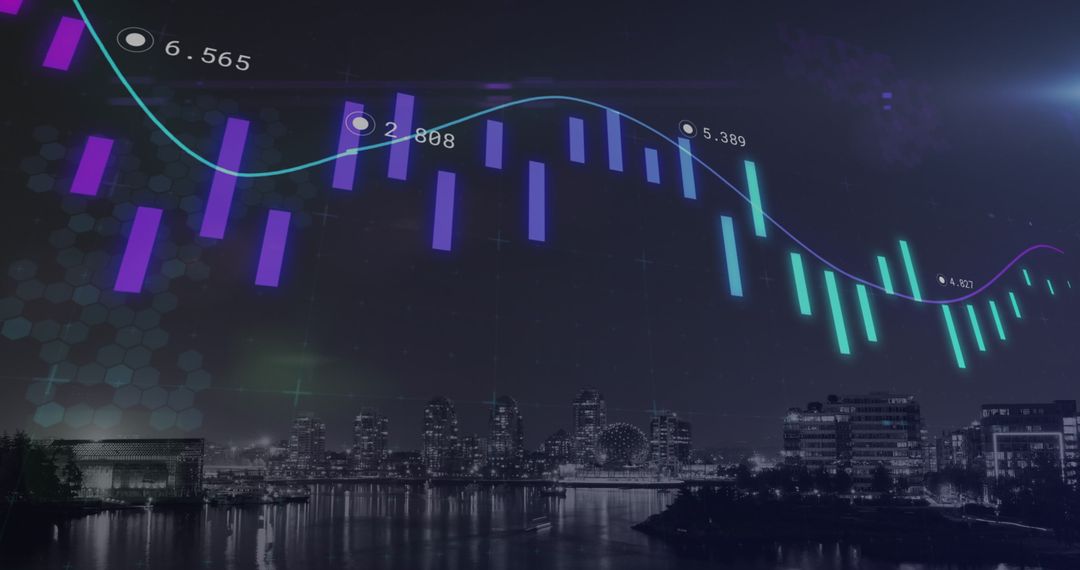
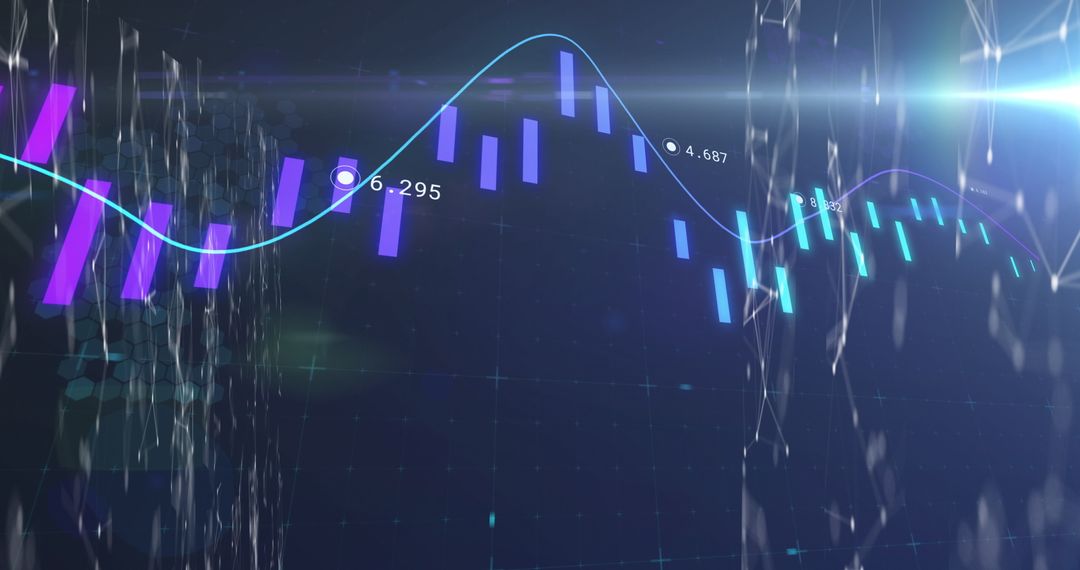
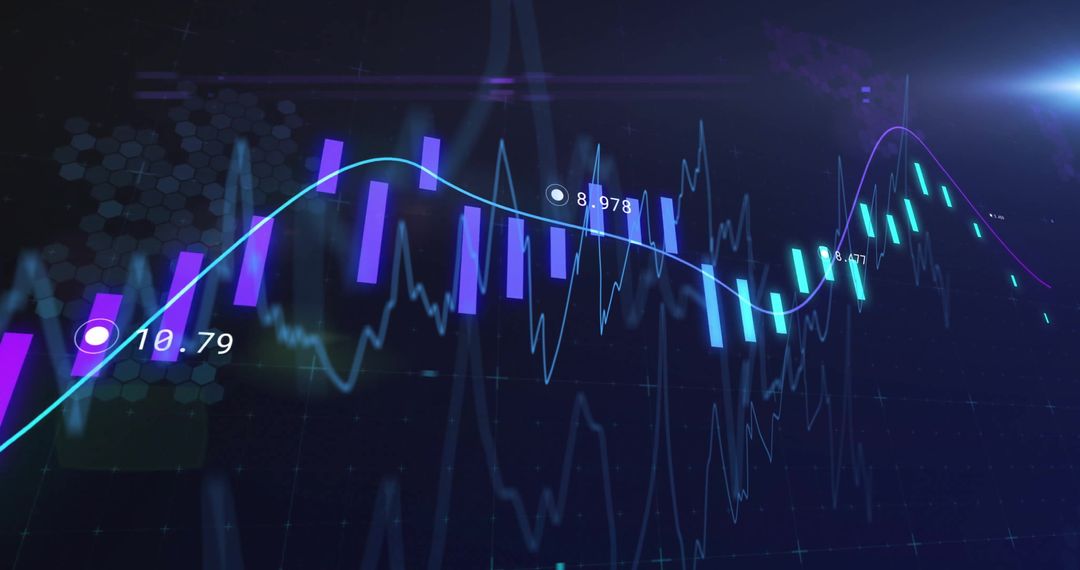
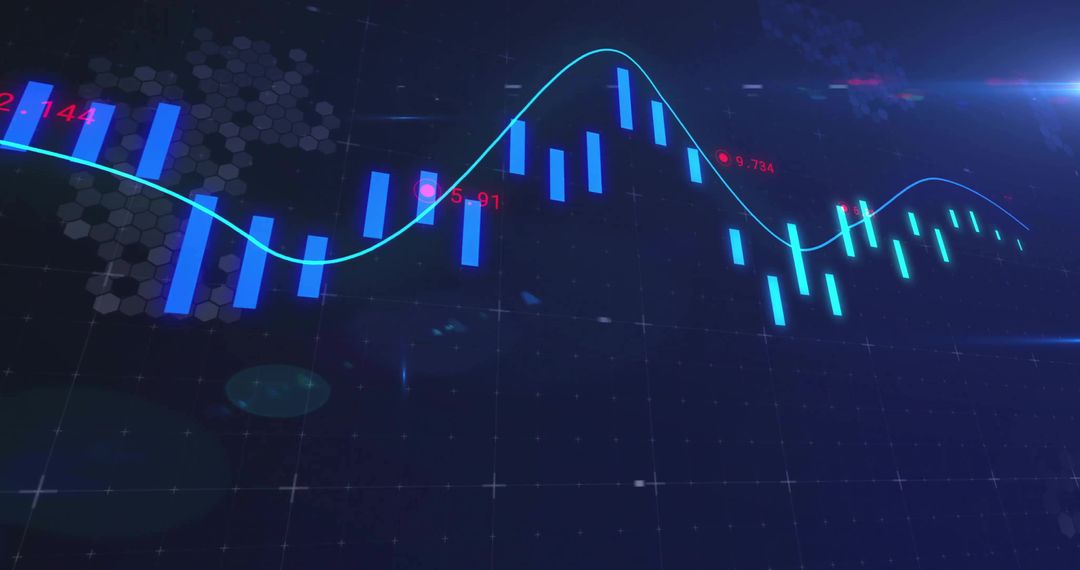
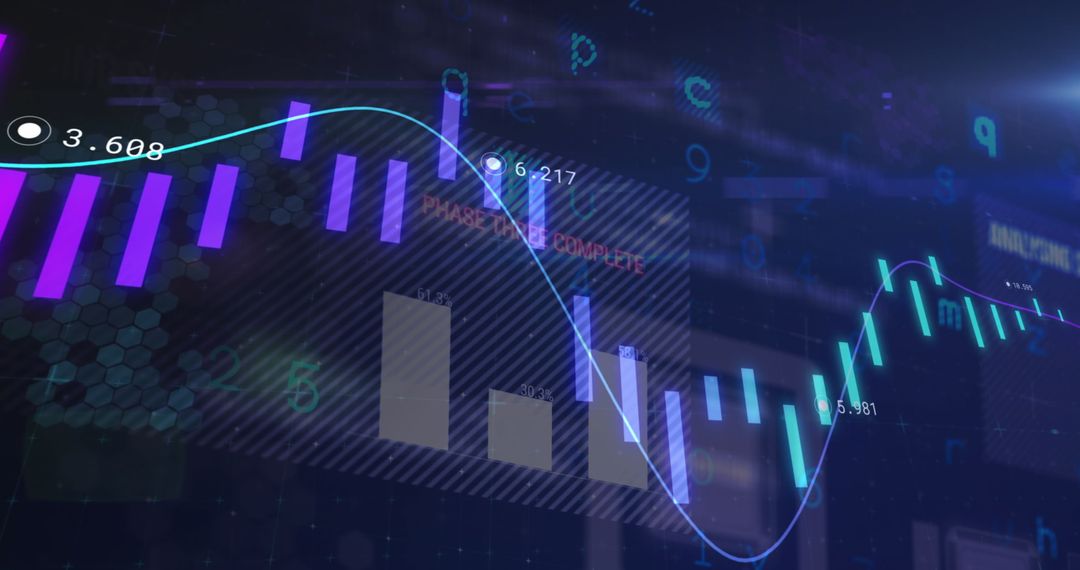
- Futuristic Data Visualization with Neon Charts and Graphs
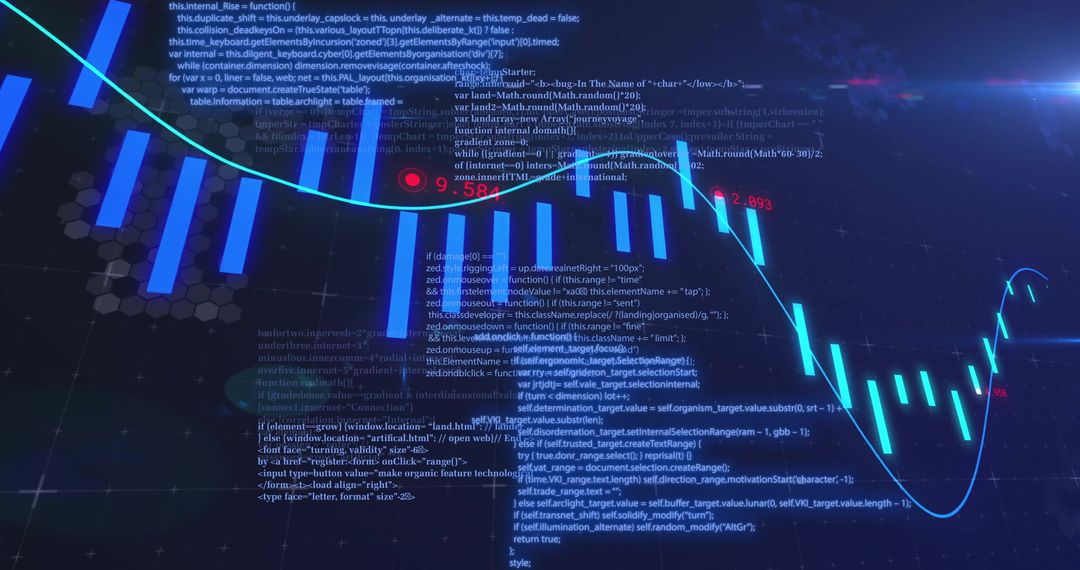
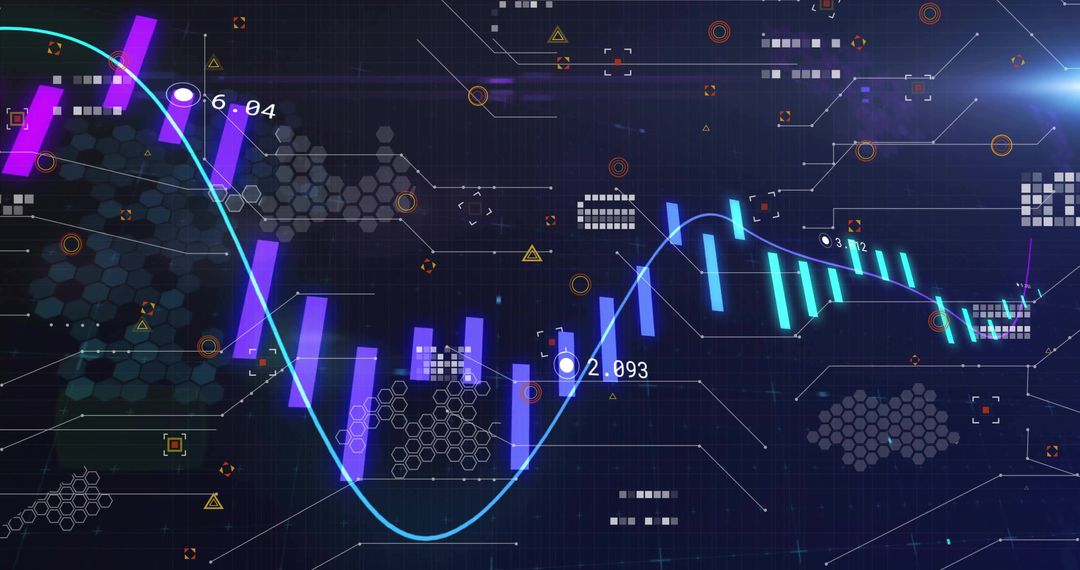
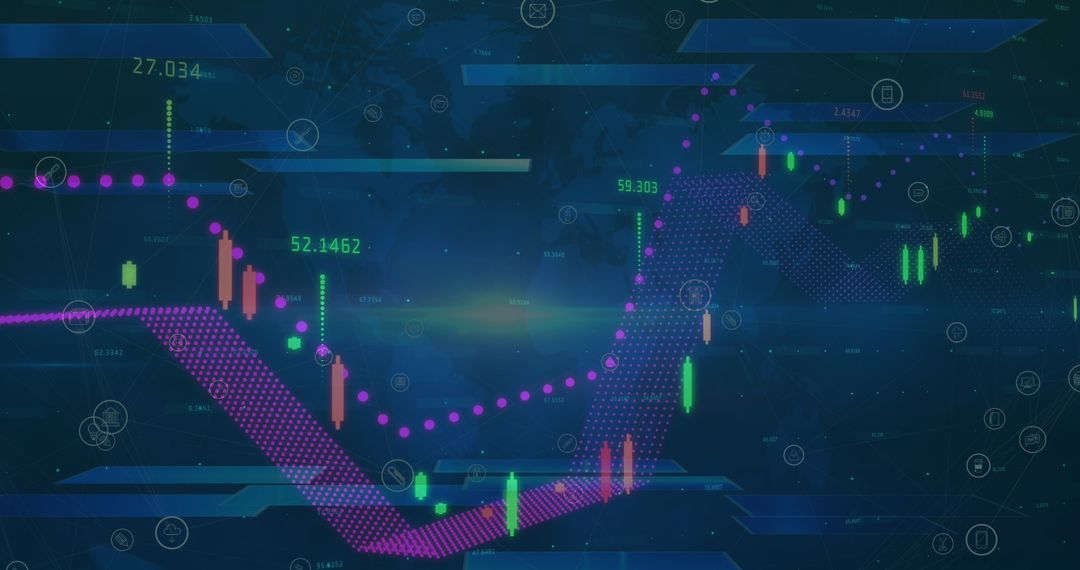
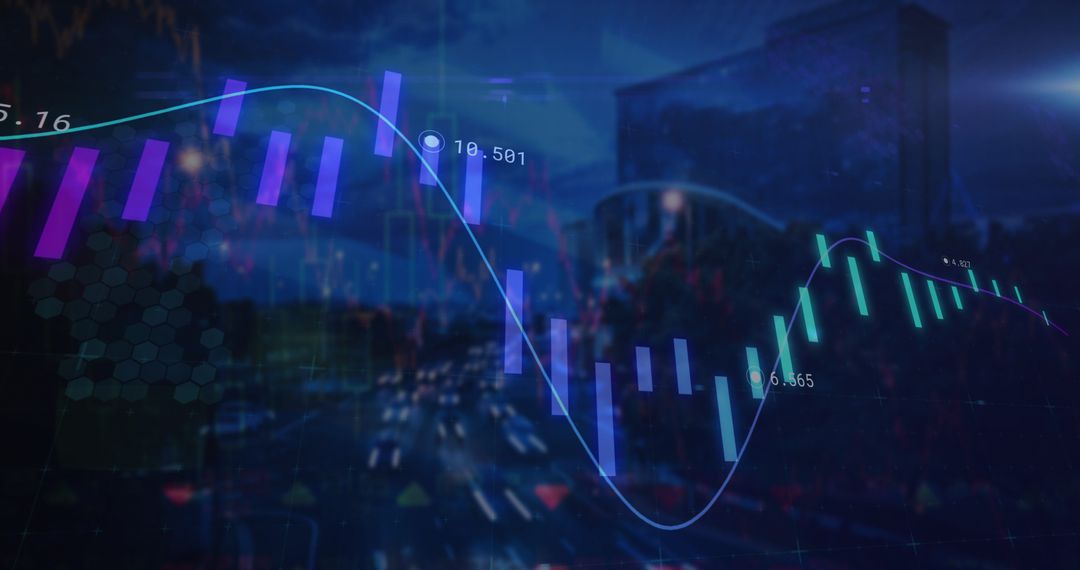
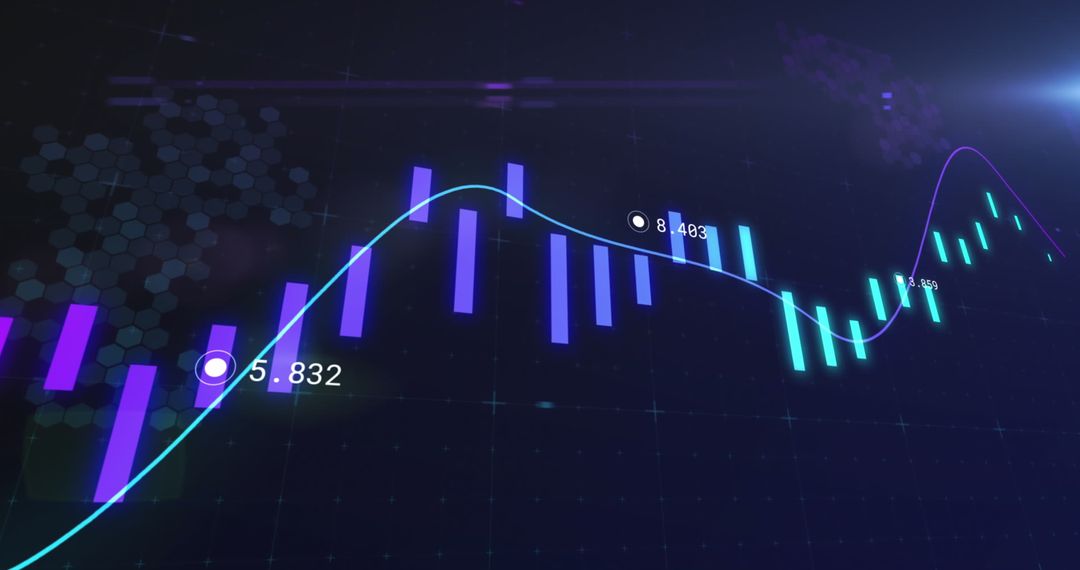
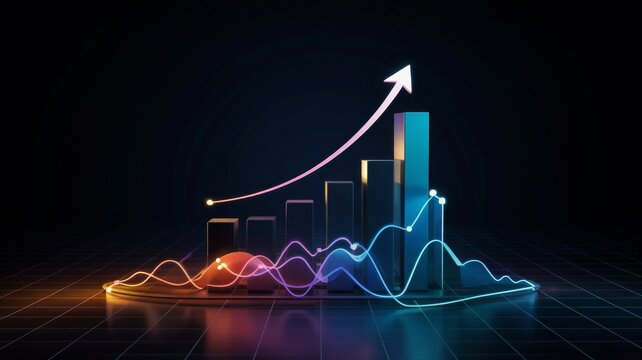
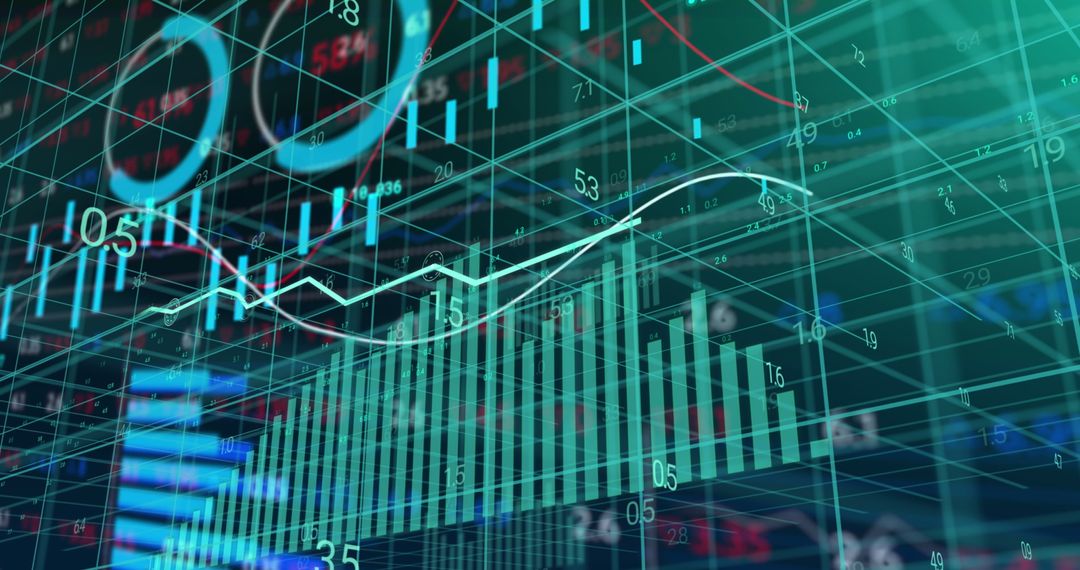
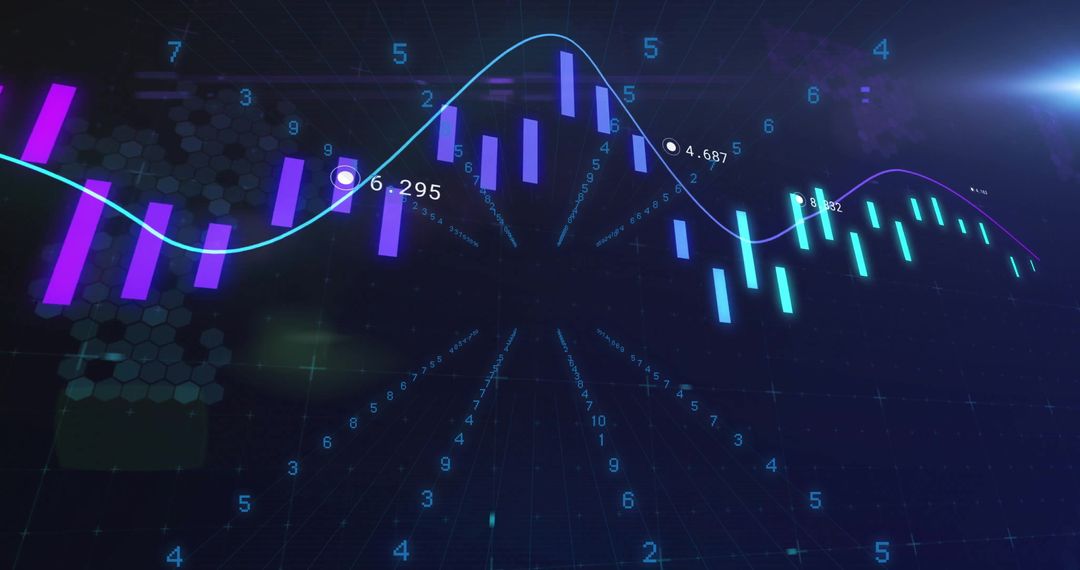
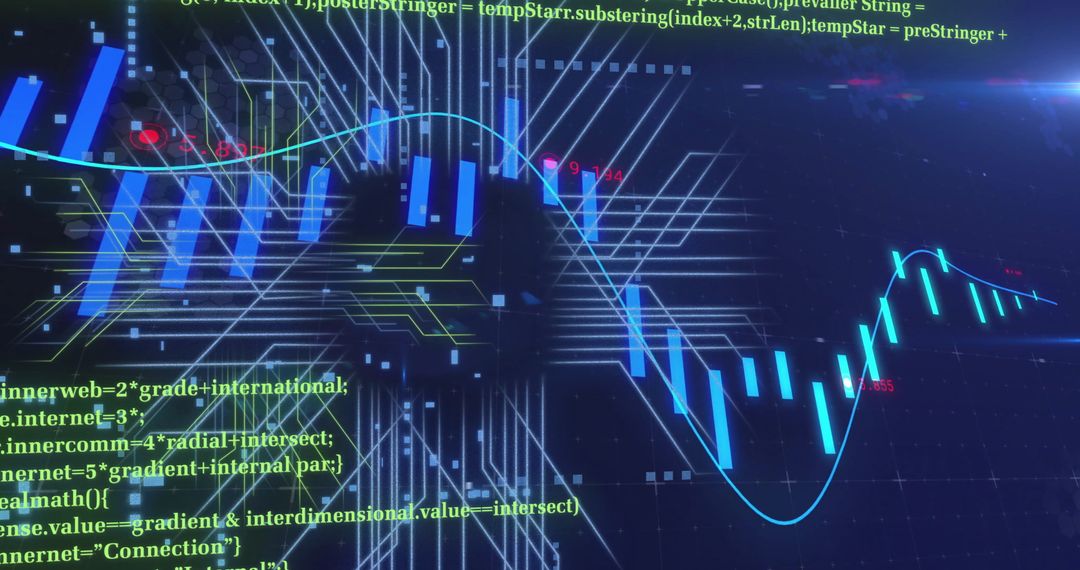
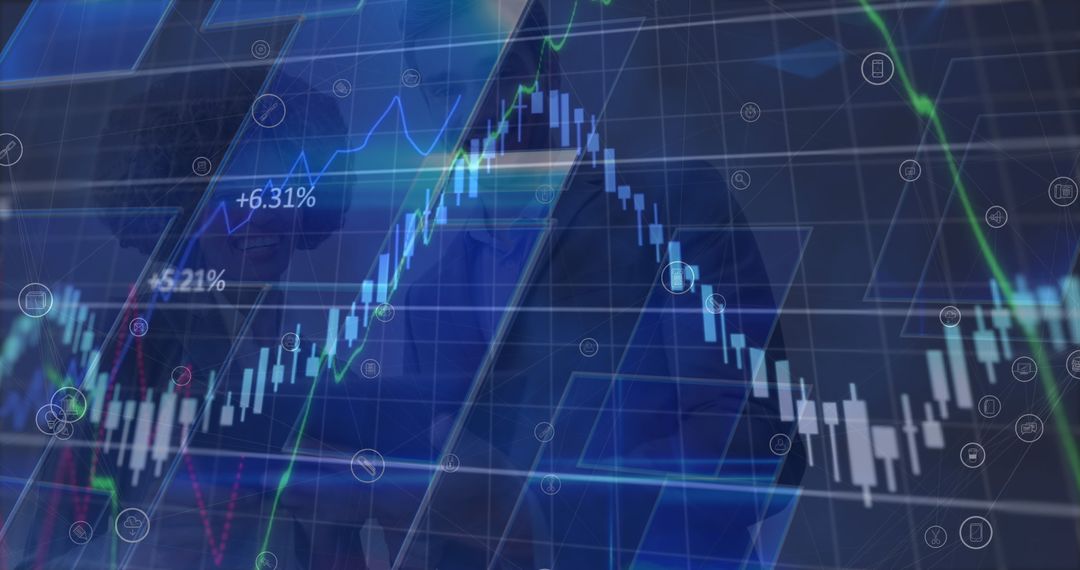
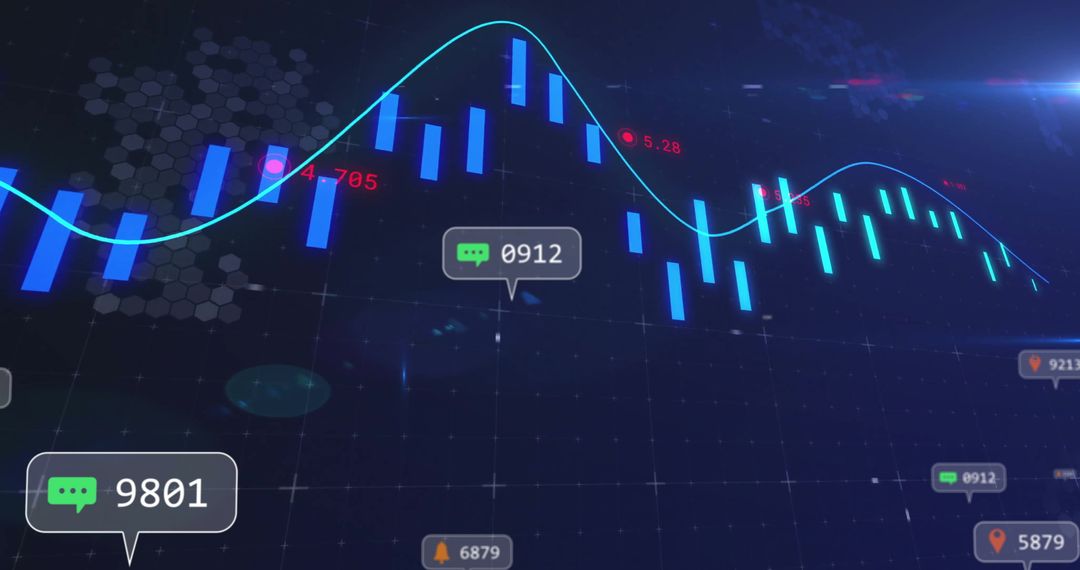
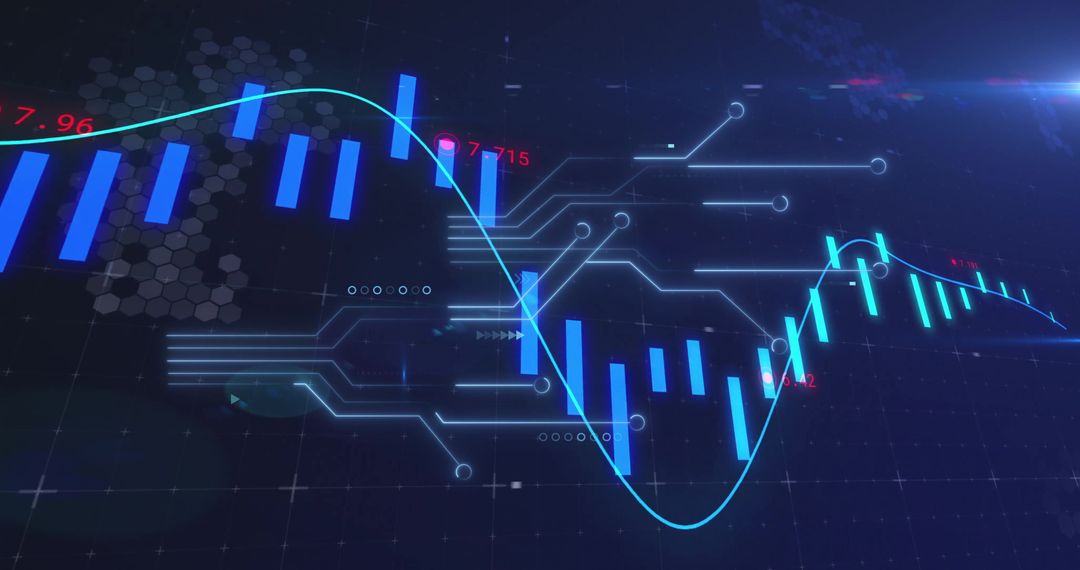
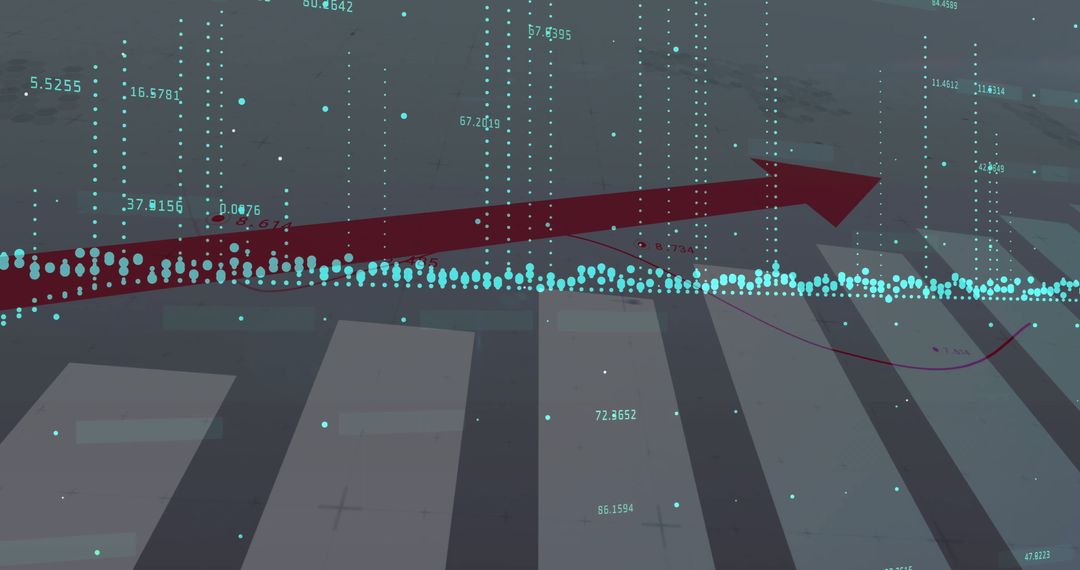
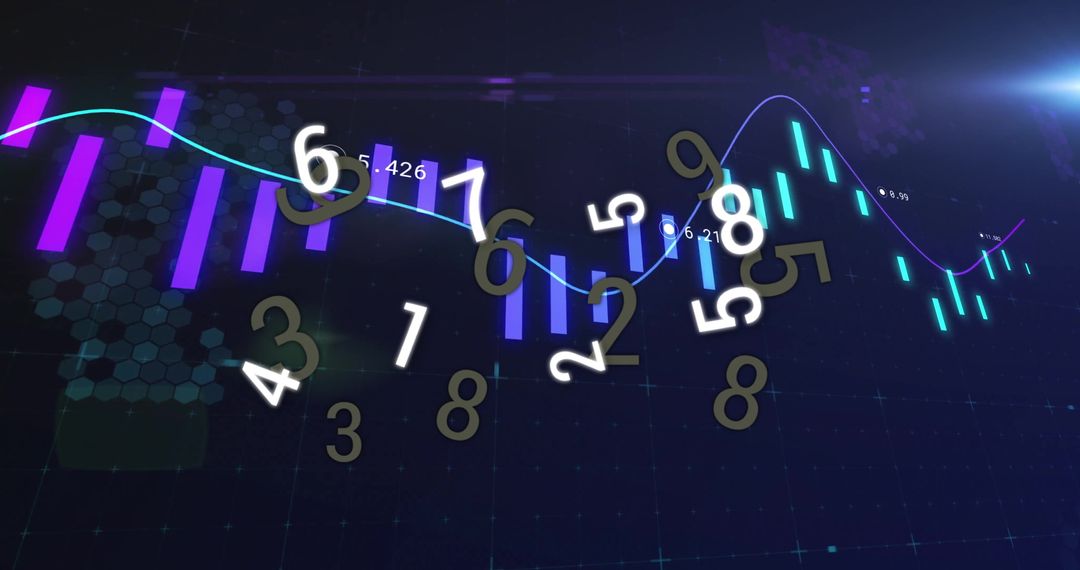
Futuristic Data Visualization with Neon Charts and Graphs Image
This visual captures the essence of data visualization through neon-colored 3D bar-line charts on a dark background. The integration of numerical labels, hex patterns, and digital flare enhances its futuristic appeal. Ideal for illustrating concepts of financial market analysis, big data insights, technological innovation, and digital transformation presentations. Perfect for technology blogs, data science educational materials, and corporate strategy reports.
Powered by 


0
downloads
downloads
Tags:
More
Credit Photo
If you would like to credit the Photo, here are some ways you can do so
Text Link
photo Link
<span class="text-link">
<span>
<a target="_blank" href=https://pikwizard.com/photo/futuristic-data-visualization-with-neon-charts-and-graphs/56988ec28016c20de1e337a2974a6623/>PikWizard</a>
</span>
</span>
<span class="image-link">
<span
style="margin: 0 0 20px 0; display: inline-block; vertical-align: middle; width: 100%;"
>
<a
target="_blank"
href="https://pikwizard.com/photo/futuristic-data-visualization-with-neon-charts-and-graphs/56988ec28016c20de1e337a2974a6623/"
style="text-decoration: none; font-size: 10px; margin: 0;"
>
<img src="https://pikwizard.com/pw/medium/56988ec28016c20de1e337a2974a6623.jpg" style="margin: 0; width: 100%;" alt="" />
<p style="font-size: 12px; margin: 0;">PikWizard</p>
</a>
</span>
</span>
Free (free of charge)
Free for personal and commercial use.
Author: Awesome Content
Similar Free Stock Images

Premium


Premium


Premium

Premium

Premium


Premium

Premium

Premium


Premium

Premium

Premium


Premium

Premium


Premium

Premium

Premium


Premium

Premium


Premium

Premium


Premium


Premium

Premium


Premium