- Home >
- Stock Photos >
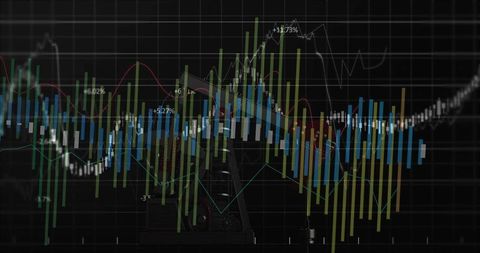
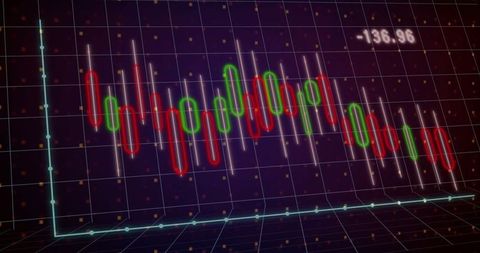
- Futuristic Data Visualization with Neon Grid and Line Charts
Futuristic Data Visualization with Neon Grid and Line Charts Image

This abstract visualization shows digital analytics using vibrant neon elements with a combination of bar charts and variable lines marked with key points overlaid on grid axes. Ideal for illustrating advanced technological and financial concepts, it's suitable for websites, presentations, and reports focussing on futuristic data analysis and business strategy insights.

downloads
Tags:
More
Credit Photo
If you would like to credit the Photo, here are some ways you can do so
Text Link
photo Link
<span class="text-link">
<span>
<a target="_blank" href=https://pikwizard.com/photo/futuristic-data-visualization-with-neon-grid-and-line-charts/ef59297b92ffae02e789fedeee6c9b72/>PikWizard</a>
</span>
</span>
<span class="image-link">
<span
style="margin: 0 0 20px 0; display: inline-block; vertical-align: middle; width: 100%;"
>
<a
target="_blank"
href="https://pikwizard.com/photo/futuristic-data-visualization-with-neon-grid-and-line-charts/ef59297b92ffae02e789fedeee6c9b72/"
style="text-decoration: none; font-size: 10px; margin: 0;"
>
<img src="https://pikwizard.com/pw/medium/ef59297b92ffae02e789fedeee6c9b72.jpg" style="margin: 0; width: 100%;" alt="" />
<p style="font-size: 12px; margin: 0;">PikWizard</p>
</a>
</span>
</span>
Free (free of charge)
Free for personal and commercial use.
Author: Authentic Images