
- Home >
- Stock Photos >
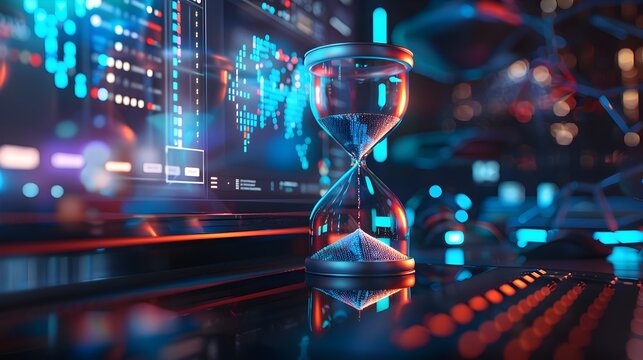
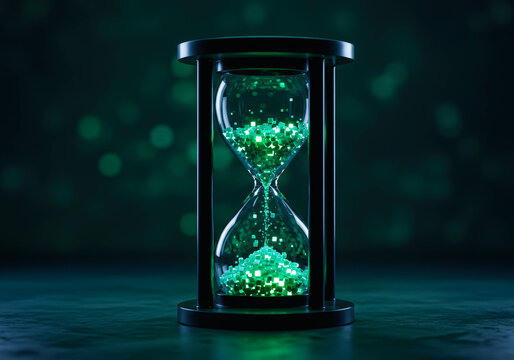
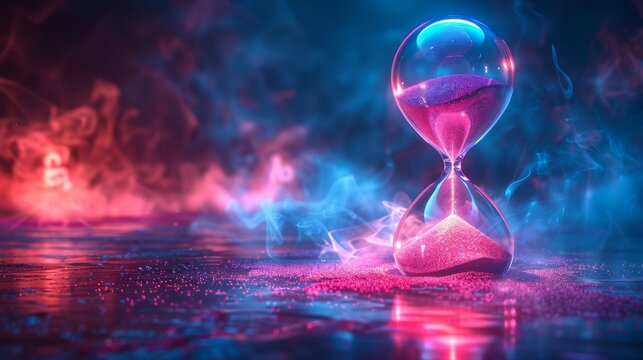
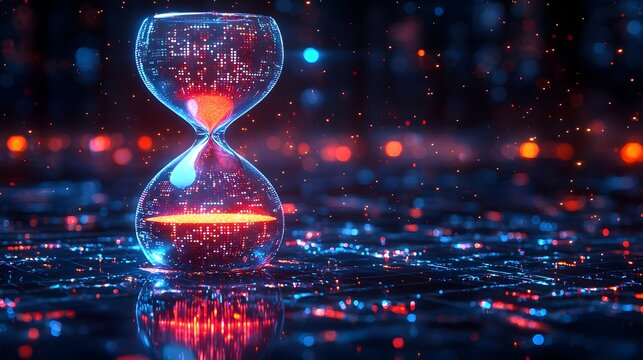
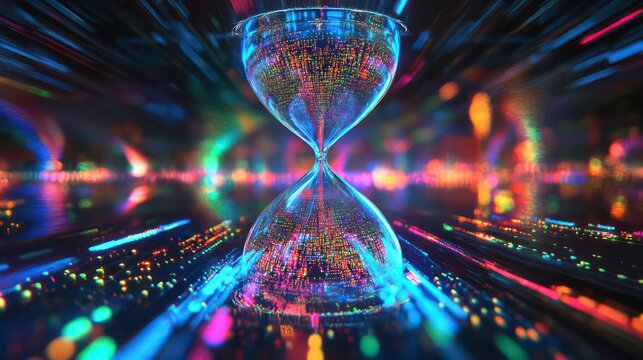
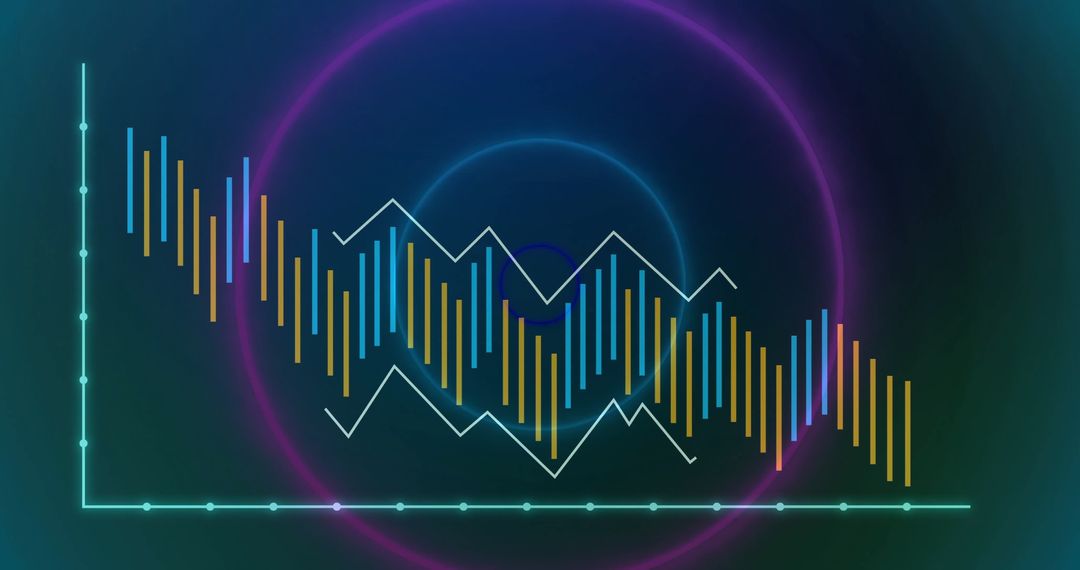
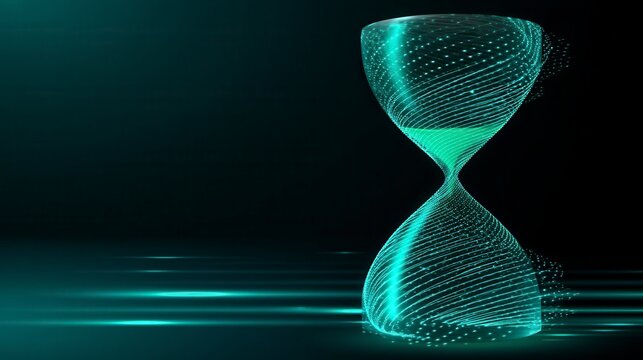
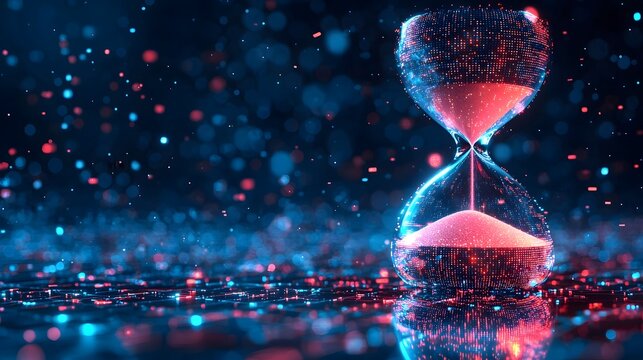
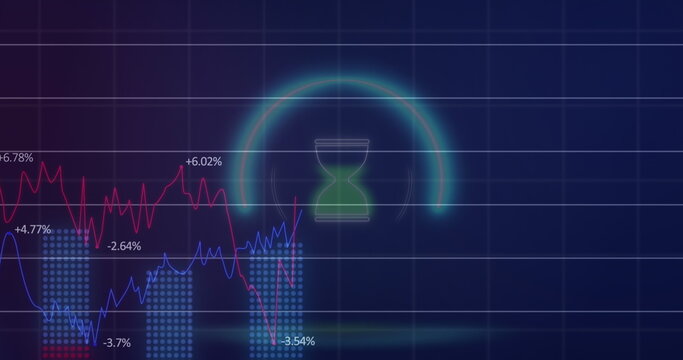
- Futuristic Data Visualization with Neon Hourglass and Bar Graph
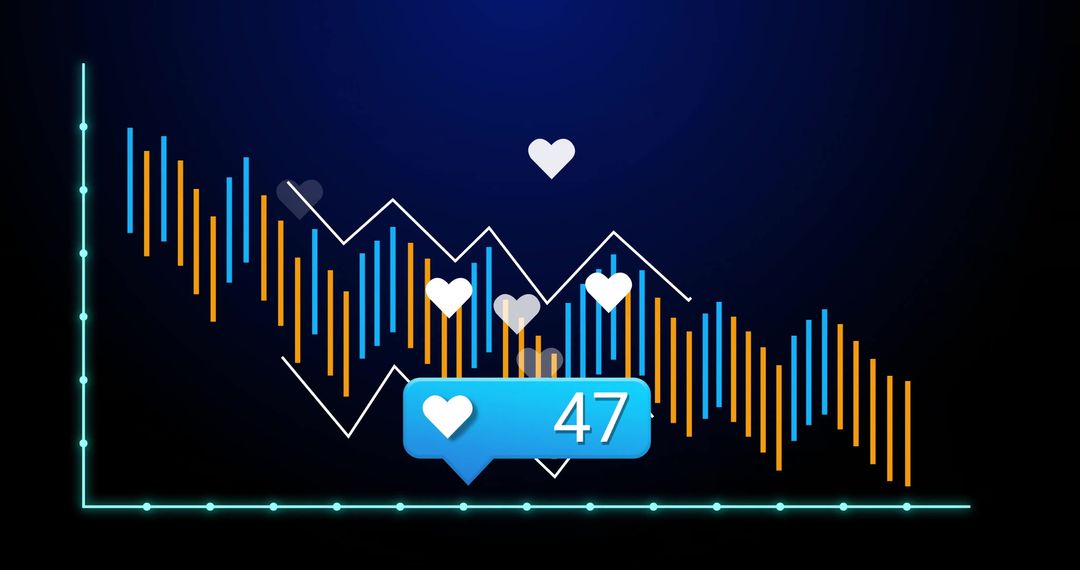
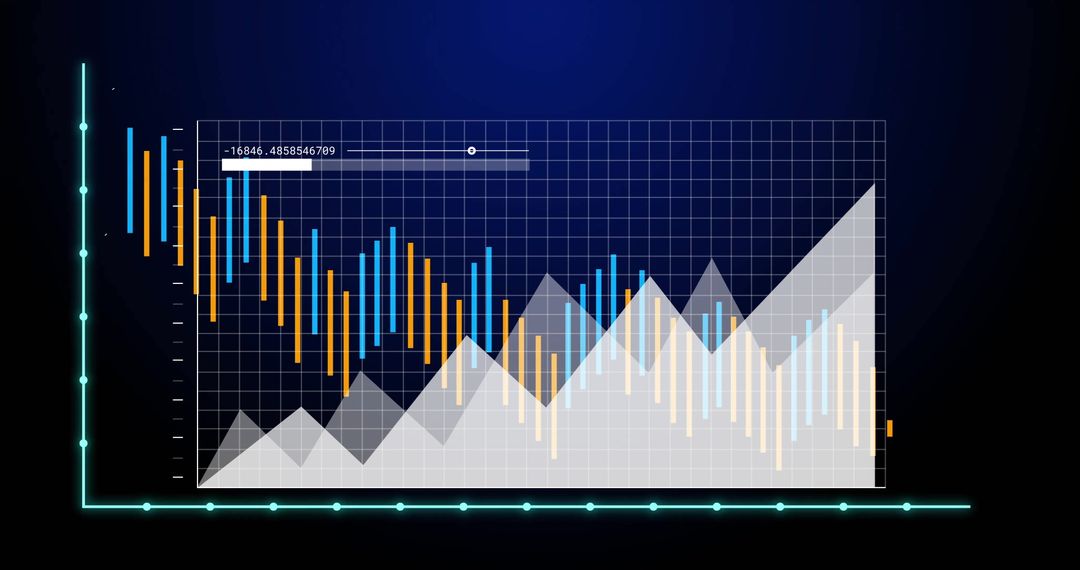
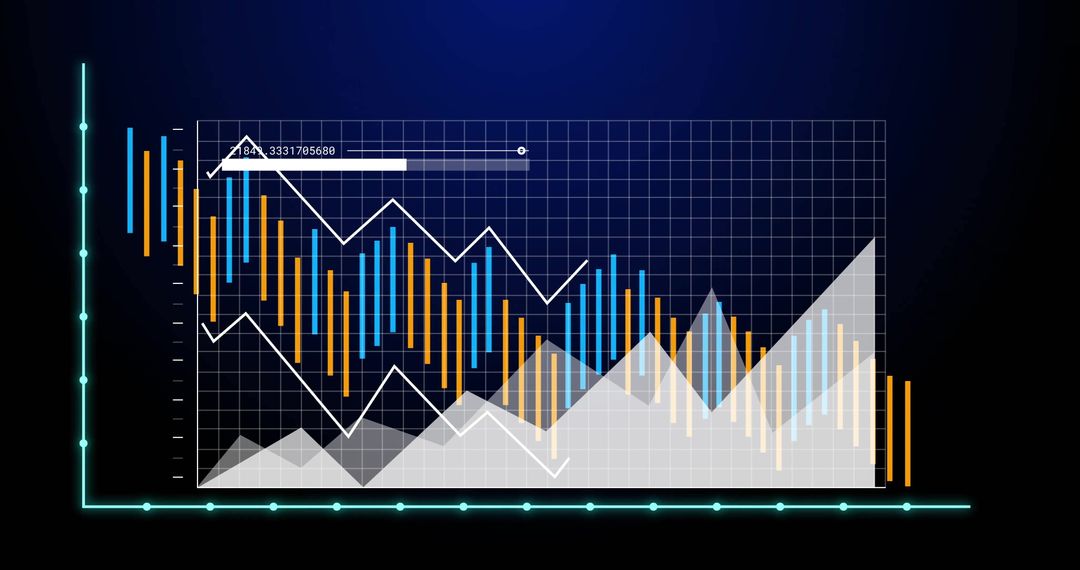
Futuristic Data Visualization with Neon Hourglass and Bar Graph Image
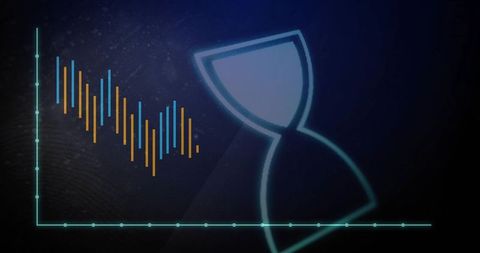
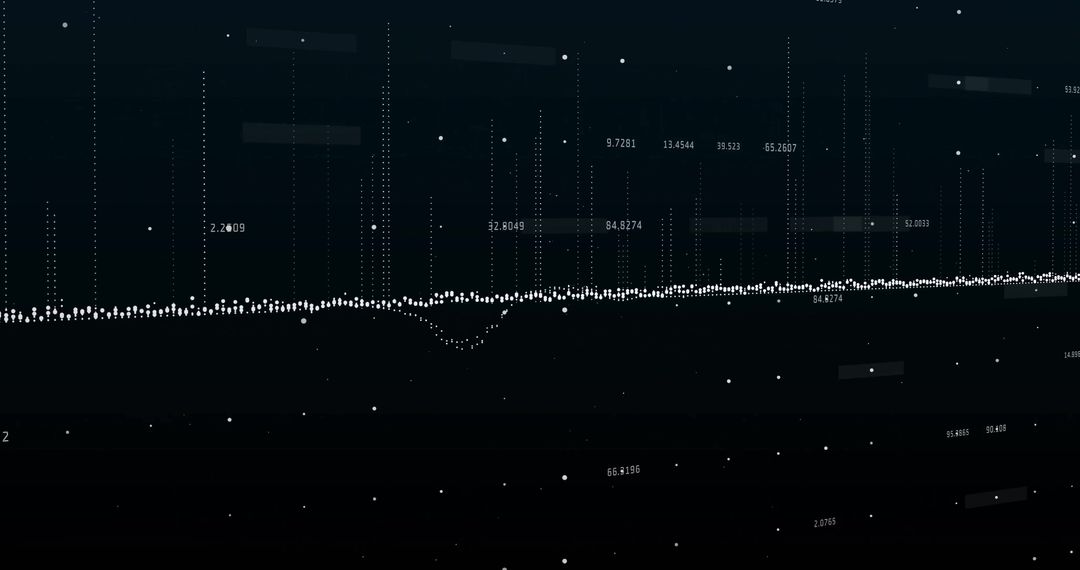
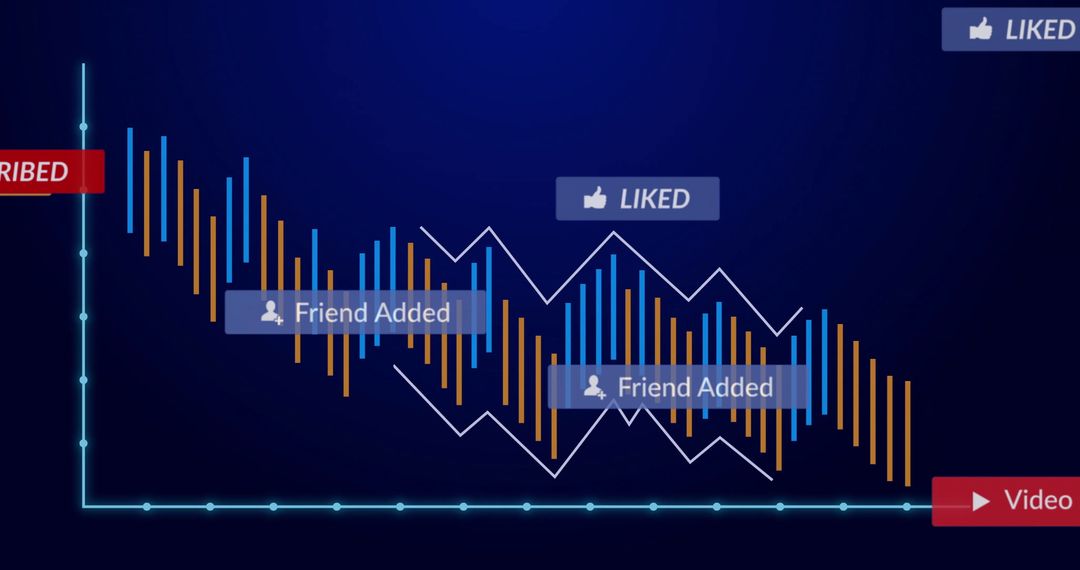
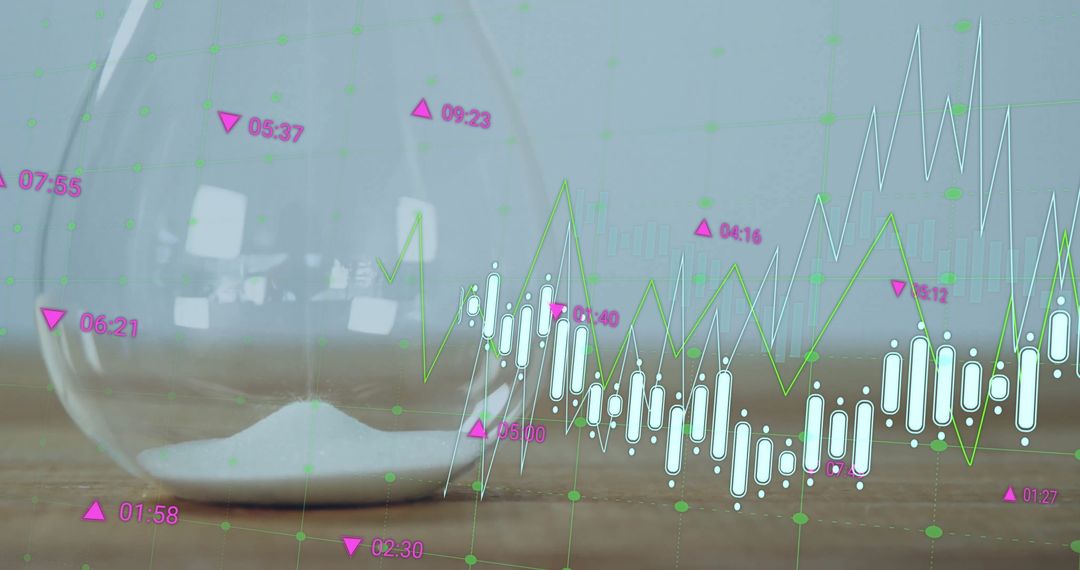
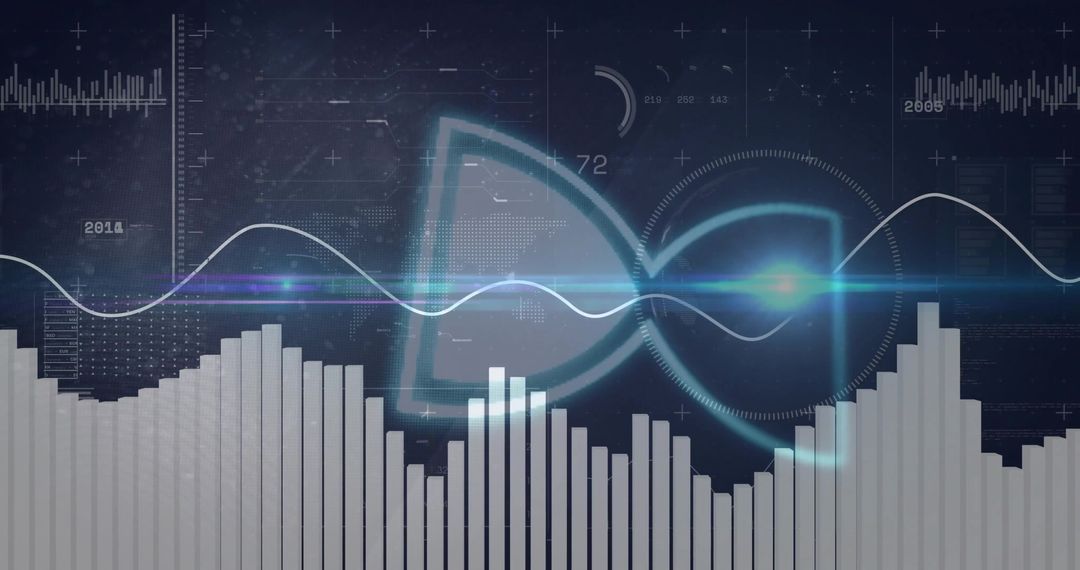
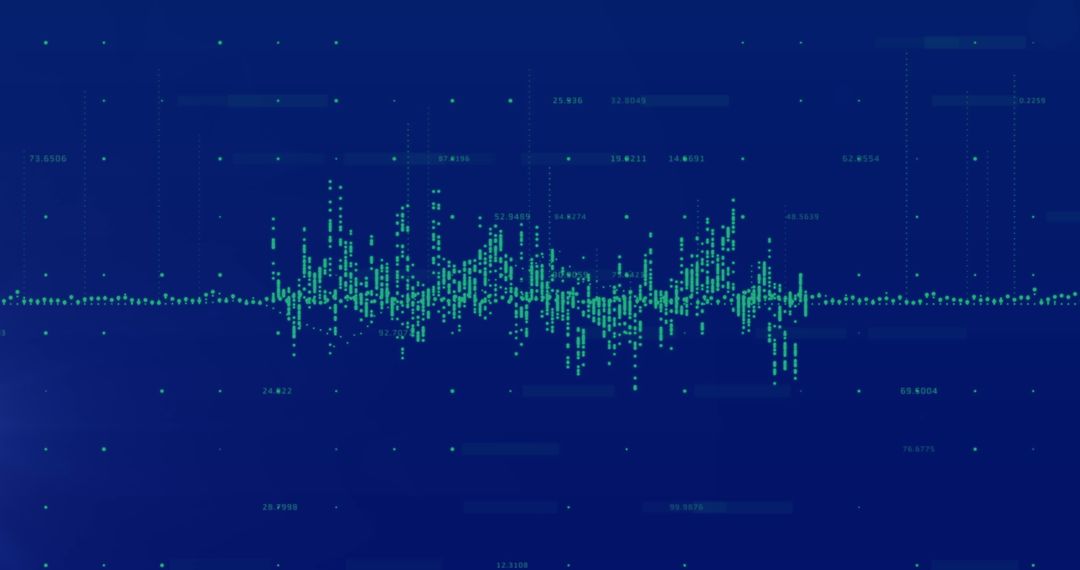
This illustration features a glowing neon-blue hourglass beside an infographic bar graph, set against a dark digital background. The hourglass symbolizes the concept of time, while the dynamic, multicolored bars convey ongoing data analysis and insights. Ideal for use in presentations focused on analytics, technology timelines, or digital innovation. The combination of colors and high-tech elements makes it suitable for tech blogs, articles regarding data trends, or futuristic digital designs.
Powered by 


0
downloads
downloads
Tags:
More
Credit Photo
If you would like to credit the Photo, here are some ways you can do so
Text Link
photo Link
<span class="text-link">
<span>
<a target="_blank" href=https://pikwizard.com/photo/futuristic-data-visualization-with-neon-hourglass-and-bar-graph/ad9319bcc3d94e065f333daca7ca988a/>PikWizard</a>
</span>
</span>
<span class="image-link">
<span
style="margin: 0 0 20px 0; display: inline-block; vertical-align: middle; width: 100%;"
>
<a
target="_blank"
href="https://pikwizard.com/photo/futuristic-data-visualization-with-neon-hourglass-and-bar-graph/ad9319bcc3d94e065f333daca7ca988a/"
style="text-decoration: none; font-size: 10px; margin: 0;"
>
<img src="https://pikwizard.com/pw/medium/ad9319bcc3d94e065f333daca7ca988a.jpg" style="margin: 0; width: 100%;" alt="" />
<p style="font-size: 12px; margin: 0;">PikWizard</p>
</a>
</span>
</span>
Free (free of charge)
Free for personal and commercial use.
Author: People Creations
Similar Free Stock Images

Premium


Premium


Premium


Premium


Premium


Premium


Premium


Premium


Premium


Premium


Premium

Premium


Premium


Premium


Premium


Premium


Premium

Premium


Premium


Premium


Premium


Premium


Premium

Premium

