
- Home >
- Stock Photos >
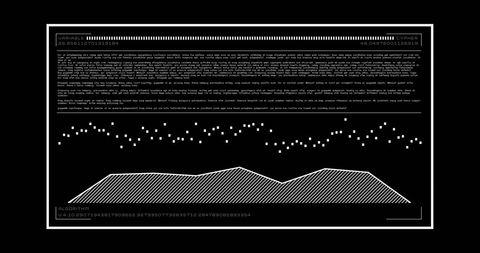
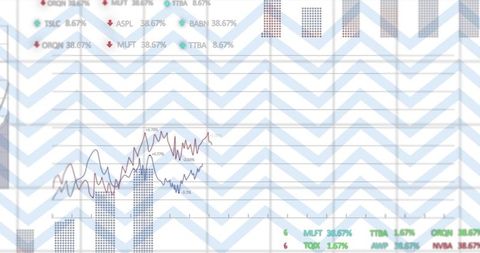
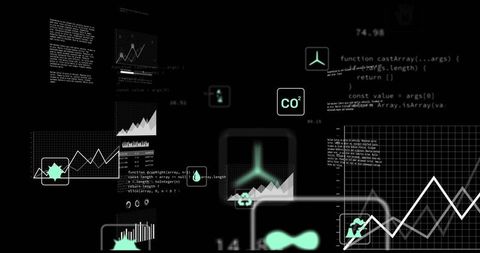
- Futuristic Data Visualization with Neon Line Graphs and Digital Interface
Futuristic Data Visualization with Neon Line Graphs and Digital Interface Image

Visualization features fluctuating neon line graphs centered on dark digital interface, enhancing data understanding by depicting technology advancement. Useful for projects on innovation, tech analytics, digital presentations, technology trends showcases, data-centric website designs, tech-focused commercials, company data dashboards displaying dynamic reports interpret analytics tracking visually advances analytics age displaying interactive sophistication creates visually fetching, sharper data appealing eye captures importance depth translates technology visually practical launches informational beauty seamless effortless.
Powered by 


downloads
Tags:
More
Credit Photo
If you would like to credit the Photo, here are some ways you can do so
Text Link
photo Link
<span class="text-link">
<span>
<a target="_blank" href=https://pikwizard.com/photo/futuristic-data-visualization-with-neon-line-graphs-and-digital-interface/ed012c6f4d132d9f9bdd521330632cc2/>PikWizard</a>
</span>
</span>
<span class="image-link">
<span
style="margin: 0 0 20px 0; display: inline-block; vertical-align: middle; width: 100%;"
>
<a
target="_blank"
href="https://pikwizard.com/photo/futuristic-data-visualization-with-neon-line-graphs-and-digital-interface/ed012c6f4d132d9f9bdd521330632cc2/"
style="text-decoration: none; font-size: 10px; margin: 0;"
>
<img src="https://pikwizard.com/pw/medium/ed012c6f4d132d9f9bdd521330632cc2.jpg" style="margin: 0; width: 100%;" alt="" />
<p style="font-size: 12px; margin: 0;">PikWizard</p>
</a>
</span>
</span>
Free (free of charge)
Free for personal and commercial use.
Author: Creative Art
Similar Free Stock Images
Premium


Premium

Premium


Premium


Premium


Premium


Premium


Premium


Premium


Premium


Premium

Premium


Premium

Premium

Premium


Premium


Premium


Premium


Premium


Premium


Premium


Premium


Premium


Premium


Premium


Explore More Free Stock Images