
- Home >
- Stock Photos >
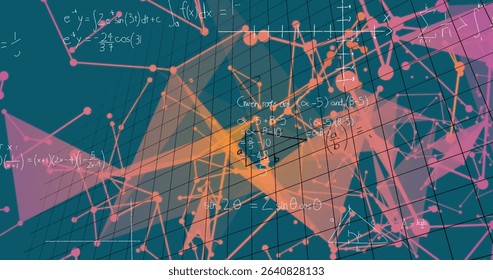
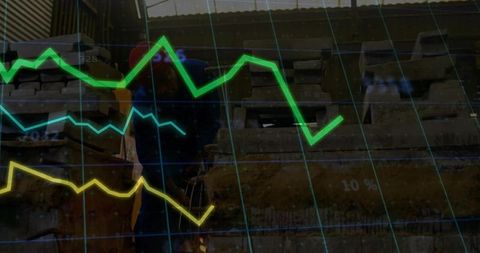
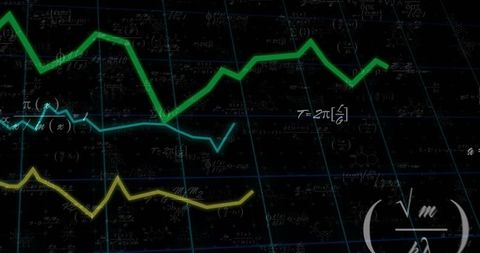
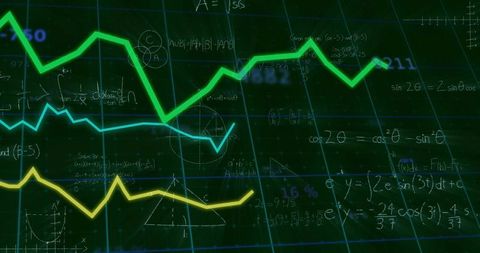
- Futuristic Data Visualization with Neon Trend Lines and Math Notations
Futuristic Data Visualization with Neon Trend Lines and Math Notations Image

A digital screen featuring neon green, cyan, and yellow jagged trend lines superimposed over a complex background of math notations and calculations. This innovative display showcases futuristic data analysis and analytics, perfect for use in digital commercials, technology-focused content, academic presentations, scientific research illustrations, or company infographics related to mathematical studies or technological advancements.
Powered by  - Get 15% off with code: PIKWIZARD15


downloads
Tags:
More
Credit Photo
If you would like to credit the Photo, here are some ways you can do so
Text Link
photo Link
<span class="text-link">
<span>
<a target="_blank" href=https://pikwizard.com/photo/futuristic-data-visualization-with-neon-trend-lines-and-math-notations/cda456611fc8170e7e4366cb6748b0e7/>PikWizard</a>
</span>
</span>
<span class="image-link">
<span
style="margin: 0 0 20px 0; display: inline-block; vertical-align: middle; width: 100%;"
>
<a
target="_blank"
href="https://pikwizard.com/photo/futuristic-data-visualization-with-neon-trend-lines-and-math-notations/cda456611fc8170e7e4366cb6748b0e7/"
style="text-decoration: none; font-size: 10px; margin: 0;"
>
<img src="https://pikwizard.com/pw/medium/cda456611fc8170e7e4366cb6748b0e7.jpg" style="margin: 0; width: 100%;" alt="" />
<p style="font-size: 12px; margin: 0;">PikWizard</p>
</a>
</span>
</span>
Free (free of charge)
Free for personal and commercial use.
Author: People Creations
Similar Free Stock Images

Premium


Premium


Premium

Premium


Premium


Premium

Premium


Premium


Premium

Premium


Premium

Premium

Premium

Premium

Premium


Premium

Premium


Premium

Premium


Premium

Premium


Premium

Premium


Premium

Premium


Explore More Free Stock Images