1. Home > 
  2. Stock Photos > 
  3. Futuristic Data Visualization with Rainbow Waves and Arrow

Futuristic Data Visualization with Rainbow Waves and Arrow Image

Futuristic Data Visualization with Rainbow Waves and Arrow

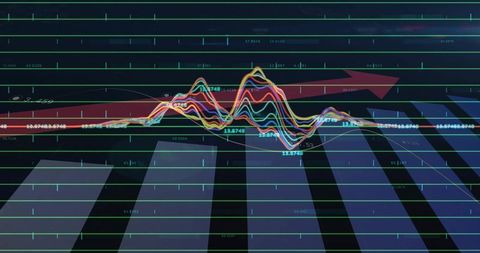
This vibrant image features rainbow waves oscillating across a digital dashboard, accompanied by red arrows and blue gridlines, highlighting technological advancement. The overlay of numbers also suggests data being analyzed or monitored in real-time. Perfect for illustrating concepts in finance, technology, data science and analytics, this imagery is ideal for presentations, reports, and marketing materials focused on technological and data-driven industries.

Powered by Shutterstock logo - Get 15% off with code: PIKWIZARD15
Two professionals in dark suits pointing at dynamic data visualizations on interactive digital interface with glowing blue elements against dark background. Concept of business, technologies, data. Ad - Powered by Shutterstock - Get 15% off with code: PIKWIZARD15Abstract flying dragons on a dark blue background. Technological background for design on the topic of artificial intelligence, neural networks, big data. Copy space - Powered by Shutterstock - Get 15% off with code: PIKWIZARD15Man look at the dashboard with graphs and charts. Concept of data management system, business intelligence, data statistics, marketing analysis, key performance indicators (KPI) and analytics. - Powered by Shutterstock - Get 15% off with code: PIKWIZARD15Data and AI Powering Global Analytics: Visualize data-driven insights with AI and big data, showcasing global networks, large language models, artificial neural network and digital transformation. - Powered by Shutterstock - Get 15% off with code: PIKWIZARD15Big data technology and data science with person touching data flowing on virtual screen. Business analytics, artificial intelligence, machine learning. Engineer or scientist analyzing stream of data. - Powered by Shutterstock - Get 15% off with code: PIKWIZARD15

Credit Photo

If you would like to credit the Photo, here are some ways you can do so

Free (free of charge)

Free for personal and commercial use.

Author: Creative Art

Similar Free Stock Images

Colorful Stock Market Graph with Data on Grid
Premium
Big data analytics with AI technology. Data analyst analyzing and visualizing complex information network with artificial intelligence. Machine learning algorithm for business analytics and finance.
Abstract Data Analysis Overlay on Coastal Landscape
Abstract Financial Data Through Graphic Overlays
Dynamic Data Analysis Visualization with Colorful Graphs
Global Financial Data Processing with Graphs and Charts Overlay
Premium
Lines and dots flying away from the center on a blue background to illustrate the information network, artificial intelligence, big data, and neural connections. Copy space
Financial Data Overlay on Glass Office Building
Red Financial Trendline in Digital Interface Background
Digital Financial Data Visualization on Grid Display
Digital Globe with Intersecting Graphs Representing Global Economy
Premium
A close-up view of a hand interacting with a digital tablet displaying various data visualizations, ideal for exploring business analytics and technology.
Digital Financial Chart Showing Growth and Dynamic Indicators
Colombian Flag Merging with Stock Market Graphs Illustrating Economy
Dynamic Financial Growth Graph on Blue Grid Background
Glowing Data Graph Overlay on Spinning Black Globe
Premium
Professional Using AI-Powered Laptop and Smartphone to Analyze Data Insights and Marketing Analytics with Holographic Graphs and Infographics, Showcasing Advanced Technology and Future Digital
Digital Data Analysis on Futuristic Interface Background
Financial Data Visualization Above Cityscape
Financial Data Analysis on World Map Background
Financial Graphs and Digital Data on Dark Background
Premium
Woman focused on analyzing dynamic data visualizations on a transparent screen, modern office background, concept of data analysis and technology
Dynamic Stock Market Graph Showing Investment Trends
Global Financial Data with Dynamic Analytics Visualization
Dynamic Financial Data Analysis Concept with Graph Lines and Orange Background
Interactive Data Visualization Dashboard with Trend Analysis
Premium
Displaying holo HUD in office, showing charts and globe, teen in denim holding blue tablet right. Holographic, visualization, analytics, futuristic, dashboard, workspace, data
Futuristic Financial Dashboard with Dynamic Stock Market Graphs
Futuristic Electric Vehicle HUD Telemetry with Neon Wave Analytics and Digital Speed Gauge
Neon Multicolor Waveform Displaying on Tech Dashboard with Teal Gridlines and Hex Icons
Market dashboard displaying candlestick chart, volume profile and moving averages
Colorful Stock Market Display with Graphs and Tickers on Blue Background
Financial Data Visualization Overlaying City Skyscraper
Premium
Scientist working with business data, finance, marketing report, Big Data Analytics technology, Processing Complexity information flow on virtual screen, machine learning, artificial intelligence, ML
Dynamic Stock Market Data Visualization on Digital Screen
Dynamic Stock Market Analysis with Trend Lines
Dynamic Financial Charts on Global Digital Grid Background
Dynamic Financial Graph Analyzing Market Trends
Premium
Smart glasses and augmented reality concept. Woman wearing modern spectacles with futuristic screen. Virtual technology. Close up of eye surrounded by business statistics and analytics. Future vision.
Dynamic Stock Market Graphics on Modern Digital Interface
Abstract Financial Graphs with Rising Trends and Positive Indicators
Dynamic Financial Graphs and Charts on Black Background
Financial Analytics Chart in Digital Interface Design
Premium
Futuristic Digital Growth Chart – 3D Bar Graph with Glowing Blue Data Visualization
Digital Data Visualization Over World Map in Network Concept
Financial Data Visualization with Network of Connections
Dynamic Financial Data Displayed on Neon Graphs
Digital Financial Graphs and Market Data Analysis
Premium
Displaying upward-trending bar chart on digital dashboard, with line graph data labels and arrow. Data visualization, analytics, futuristic, tech, intelligence, innovation, data-driven
Dynamic Red Line Graph on Digital Black Grid Background
Rising Statistical Data Visualization and Analysis
Dynamic Financial Data Analytics and Stock Market Trends
Global Data Projection Showing Stock Market Trends with Digital Globe
Premium
Displaying white infographic showing numeric values on screen with red and blue charts, grid lines. Data visualization, analytics, futuristic, digital interface, dashboard, data trends, technology
Digital Finance Graph with Data Points on Dark Background
Digital Data Analysis on Futuristic Black Background
Digital Candlestick Chart with Percentages and Analytics Lines
Red Arrow Indicating Upward Trend in Financial Graphs
Premium
Displaying dashboard showing pie, bar, line and candlestick charts with percentage labels on screen. Futuristic, analytics, technology, innovation, data, interface, visualization
Neon waveform bundle oscillating across futuristic digital dashboard with grid and data markers
Bold red downtrend line graph showing sharp market decline on financial grid dashboard
Futuristic 3D Financial Dashboard Displaying Neon Cyan Orange Line Charts with Grid View
Financial Data Analysis with Growth Trend Arrows on Digital Interface
Financial Data Overlay on Modern Skyscraper
Dynamic Financial Data Streams for Market Analysis
Premium
A hand interacts with glowing holographic data graphs and charts, showcasing futuristic digital visualization on a dark background. Concept of innovation
Dynamic Global Financial Data Display with World Map
Global Financial Data Analytics with Graphs on World Map
Futuristic Digital Graph with Arrows and Data Interface
Dynamic Financial Data Charts on Dark Digital Background
Premium
Abstract wave shape on a low-polygonal triangular background for design on the topic of cyberspace, big data, metaverse, network security, data transfer on dark blue abstract cyberspace background.
Dynamic Financial Graphs Illustrating Market Trends and Data
Digital Holographic Data Interface Display
Dynamic Analysis of Stock Market Trends and Patterns
Digital Data Processing on Interconnected Network
Premium
Scanning business-casual IT tech holding phone, viewing AR charts amid server racks, copy space. Technology, data, visualization, innovation, analytics, futuristic, professional
Digital Network Connections and Financial Data Analysis
Dynamic Financial Data Analysis with Market Charts
Stock Market Graph and Data Analysis
Dynamic Data and Graphs on Digital Screen
Premium
A high-tech environment featuring a hand interacting with a futuristic transparent touchscreen display, showcasing data analytics and digital visuals for business insights.
Financial Data Visualization with Increasing Graph Trend
Global Financial Data Analysis on Grid Background
Digital Data Analytics Growth Trend with Graphs
Digital Financial Data Over Globe with Graphs
Premium
Digital economic growth chart with a rising trend towards 2025, symbolizing future market predictions.
Blue Bar Chart with Downward Pink Arrow Showing Data Trend
Futuristic Data Visualization Interface with Globe and Analytics
Data Visualization Overlay on Urban Skyline with Analytics Graph
Digital Analytics Dashboard with Gray Vertical Bars and Line Graphs
Premium
Digital approval and task management with futuristic interface. Businessman using stylus on tablet to complete checklist, analyze data on smart dashboard. Concept of workflow automation, e-signature.
Displaying Neon Waveform Analytics HUD Showing Colorful Oscillating Data Lines
Market Dashboard Showing Downward Arrow Over Candlestick Charts and Percentage Labels
Financial Data Display Over Modern Office Architecture
Financial Graphs with Globally Inspired Data Visualization
Digital Interface with Spinning Scanner and Statistical Data
Financial Data Analytics Over Urban Skyline Concept
Premium
Big data analysis with AI technology. Person using machine learning and deep learning neural network for data science, data mining, business analytics, automation, data engineering. Glowing particles.
Financial Data Display in Digital Grid Design
Financial Data Visualization Against Glass Office Facade
Interface Displaying Financial Data and Graphs
Interactive Financial Data Analysis with Digital Technology
Premium
Man look at the dashboard with graphs and charts. Concept of data management system, business intelligence, data statistics, marketing analysis, key performance indicators (KPI) and analytics.
Financial Market Chart on Digital Screen Showing Growing Trends
Abstract Financial Data with Digitally Enhanced Graphs
Data Processing with Virtual Grid and Cloud Imagery
5G 6G Digital Interface With Global Connectivity Graphs
Premium
beautiful abstract wave technology background with blue light, digital wave effect, corporate concept
Dynamic Data Processing with Digital Interfaces in Motion
Abstract Data Visualization with Colorful Arrows and Circles
Dynamic Digital Data Display with Vibrant Graphs
Complex Digital Financial Data on Grid
Premium
Displaying neon-blue grid above blurred city skyline, tracking green, light-blue, yellow line plots. Technology, data visualization, analytics, futuristic, digital, innovation, business intelligence
Global Financial Market Trends on Digital Screen
Abstract Data Visualization with Neon Waveforms
Abstract Data Wave Patterns on Technology Interface
Dynamic Financial Data Growth Chart Display
Premium
Data driven concept with businessman use virtual touchscreens with data in graphs and trends to make decisions and implement marketing strategies to reach more customers
Futuristic Dashboard with Neon Line Graphs and Digital Interface
Analytical Trading Dashboard with Rising Candlestick Charts
Futuristic Data Visualization with Teal Grid Interface and Waveform Lines
Cyber Analytics Dashboard Showing Multicolor Waveforms on Neon Cyan Grid Interface
Premium
Examining 2 doctors checking tablet in hospital with white lab coats and stethoscopes, digital map. Clinic, collaboration, data, visualization, analytics, corridor, futuristic
Candlestick and line market chart visualizing stock performance with percentage gain labels