
- Home >
- Stock Photos >
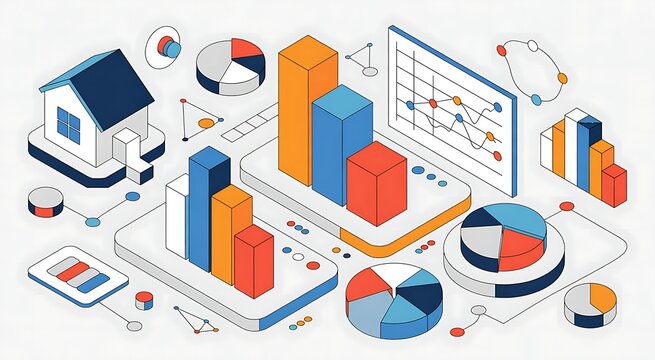
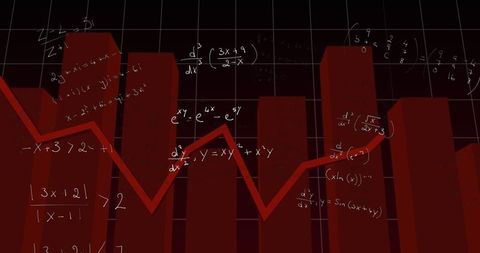
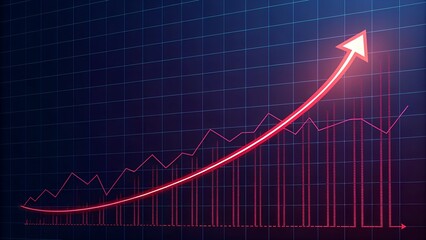
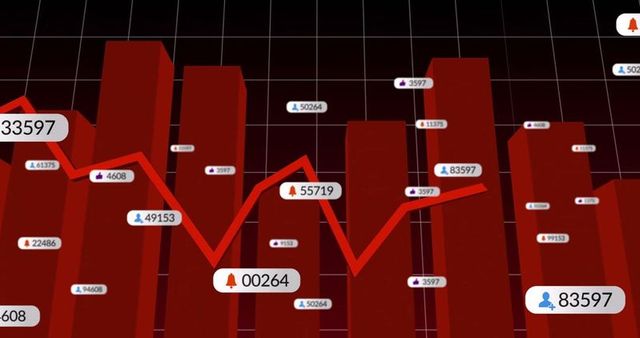
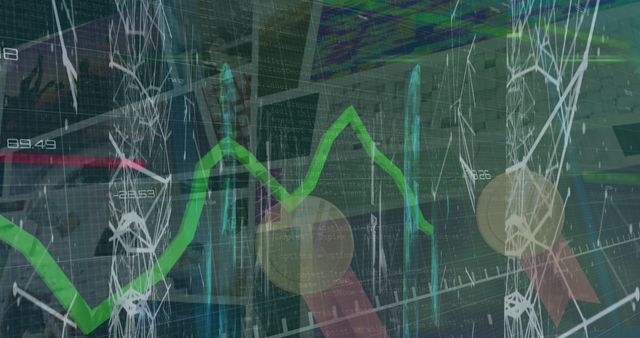
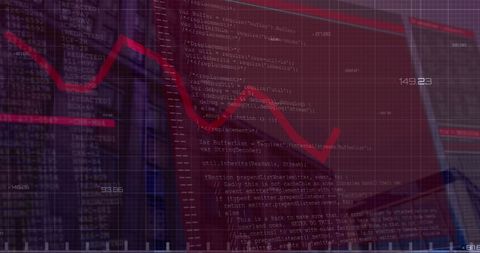
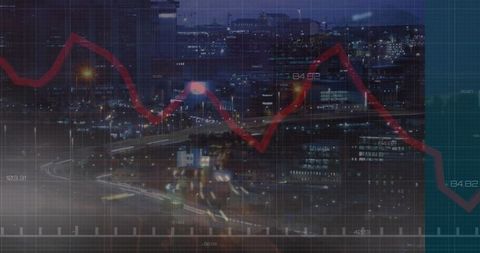
- Futuristic Data Visualization with Red Line Graph and Bar Chart
Futuristic Data Visualization with Red Line Graph and Bar Chart Image

Conceptual representation of data analytics prominently features red line graph trending peaks and troughs against a digital grid containing a muted color scheme. This futuristic and tech-driven illustration includes geometric nodes, emphasizing finance and technological themes. Ideal for use in presentations on data analysis, financial projections, strategic planning, trend forecasting, or innovative technology solutions.
Powered by 


downloads
Tags:
More
Credit Photo
If you would like to credit the Photo, here are some ways you can do so
Text Link
photo Link
<span class="text-link">
<span>
<a target="_blank" href=https://pikwizard.com/photo/futuristic-data-visualization-with-red-line-graph-and-bar-chart/e59da297af140a0a1381602f549eb7c8/>PikWizard</a>
</span>
</span>
<span class="image-link">
<span
style="margin: 0 0 20px 0; display: inline-block; vertical-align: middle; width: 100%;"
>
<a
target="_blank"
href="https://pikwizard.com/photo/futuristic-data-visualization-with-red-line-graph-and-bar-chart/e59da297af140a0a1381602f549eb7c8/"
style="text-decoration: none; font-size: 10px; margin: 0;"
>
<img src="https://pikwizard.com/pw/medium/e59da297af140a0a1381602f549eb7c8.jpg" style="margin: 0; width: 100%;" alt="" />
<p style="font-size: 12px; margin: 0;">PikWizard</p>
</a>
</span>
</span>
Free (free of charge)
Free for personal and commercial use.
Author: Awesome Content
Similar Free Stock Images

Premium

Premium
Premium


Premium

Premium


Premium


Premium


Premium


Premium
Premium

Premium
Premium


Premium


Premium


Premium


Premium


Premium

Premium


Premium


Premium


Premium


Premium


Premium

Premium

Premium

Explore More Free Stock Images