
- Home >
- Stock Photos >
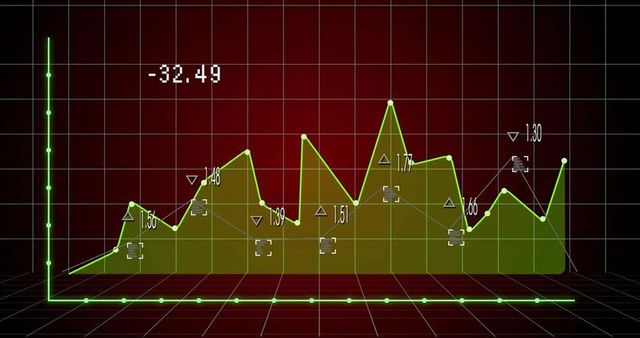
- Futuristic Data Visualization with Social Media Elements
Futuristic Data Visualization with Social Media Elements Image

This vibrant image illustrates a glowing green line chart set against a red digital grid, enhanced by live social media UI bubbles indicating likes and comments. It conveys a sense of technology and analytics in a modern digital context. Ideal for use in presentations and articles on data analytics, digital arts, social media trends, and futuristic technology. Perfect for blog posts or backgrounds in digital marketing material.
Powered by  - Get 15% off with code: PIKWIZARD15


downloads
Tags:
More
Credit Photo
If you would like to credit the Photo, here are some ways you can do so
Text Link
photo Link
<span class="text-link">
<span>
<a target="_blank" href=https://pikwizard.com/photo/futuristic-data-visualization-with-social-media-elements/f4542b767d7521517ded86f8699b3258/>PikWizard</a>
</span>
</span>
<span class="image-link">
<span
style="margin: 0 0 20px 0; display: inline-block; vertical-align: middle; width: 100%;"
>
<a
target="_blank"
href="https://pikwizard.com/photo/futuristic-data-visualization-with-social-media-elements/f4542b767d7521517ded86f8699b3258/"
style="text-decoration: none; font-size: 10px; margin: 0;"
>
<img src="https://pikwizard.com/pw/medium/f4542b767d7521517ded86f8699b3258.jpg" style="margin: 0; width: 100%;" alt="" />
<p style="font-size: 12px; margin: 0;">PikWizard</p>
</a>
</span>
</span>
Free (free of charge)
Free for personal and commercial use.
Author: Creative Art
Similar Free Stock Images

Premium


Premium

Premium


Premium


Premium


Premium


Premium


Premium

Premium

Premium

Premium


Premium


Premium


Premium


Premium


Premium


Premium


Premium


Premium


Premium


Premium

Premium


Premium


Premium


Premium


Explore More Free Stock Images