
- Home >
- Stock Photos >
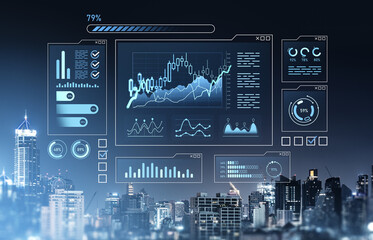
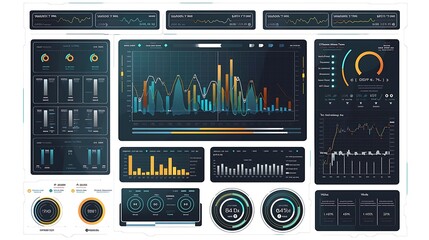
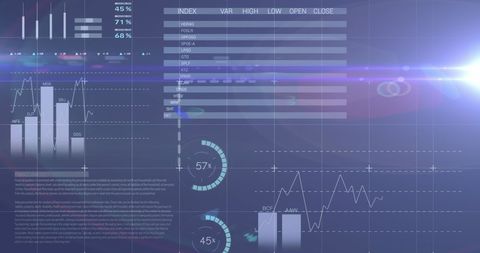
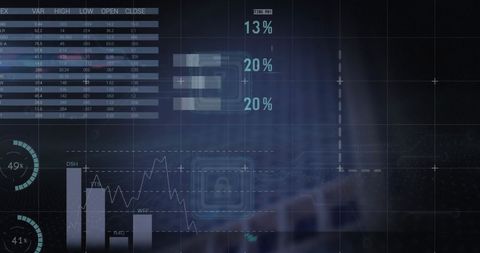
- Futuristic Data Visualization with Stock Dashboard and Charts
Futuristic Data Visualization with Stock Dashboard and Charts Image
Ideal for presentations depicting modern financial analytics or technology solutions. Useful for illustrating content related to financial trends or cybersecurity. Engages viewers interested in data-driven interfaces.
Powered by 


downloads
Tags:
More
Credit Photo
If you would like to credit the Photo, here are some ways you can do so
Text Link
photo Link
<span class="text-link">
<span>
<a target="_blank" href=https://pikwizard.com/photo/futuristic-data-visualization-with-stock-dashboard-and-charts/30f3ffabb1d4fb1edec74e96cc7283f3/>PikWizard</a>
</span>
</span>
<span class="image-link">
<span
style="margin: 0 0 20px 0; display: inline-block; vertical-align: middle; width: 100%;"
>
<a
target="_blank"
href="https://pikwizard.com/photo/futuristic-data-visualization-with-stock-dashboard-and-charts/30f3ffabb1d4fb1edec74e96cc7283f3/"
style="text-decoration: none; font-size: 10px; margin: 0;"
>
<img src="https://pikwizard.com/pw/medium/30f3ffabb1d4fb1edec74e96cc7283f3.jpg" style="margin: 0; width: 100%;" alt="" />
<p style="font-size: 12px; margin: 0;">PikWizard</p>
</a>
</span>
</span>
Free (free of charge)
Free for personal and commercial use.
Author: People Creations
Similar Free Stock Images

Premium


Premium
Premium

Premium


Premium


Premium


Premium


Premium

Premium


Premium


Premium


Premium


Premium

Premium

Premium


Premium

Premium


Premium


Premium


Premium


Premium


Premium


Premium


Premium


Premium

Explore More Free Stock Images