
- Home >
- Stock Photos >
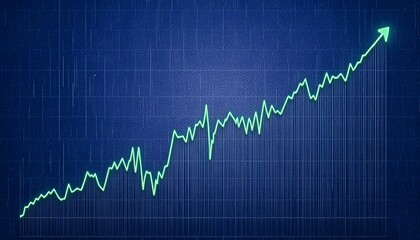
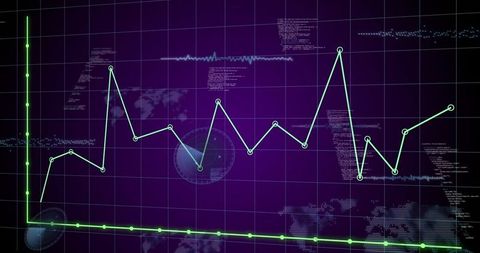
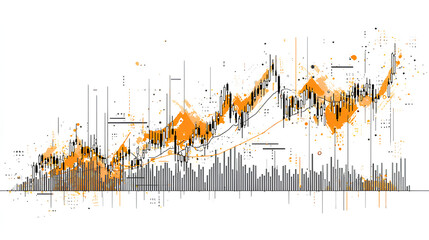
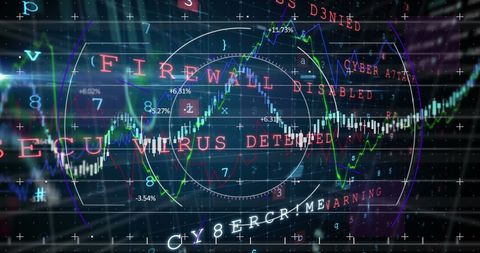
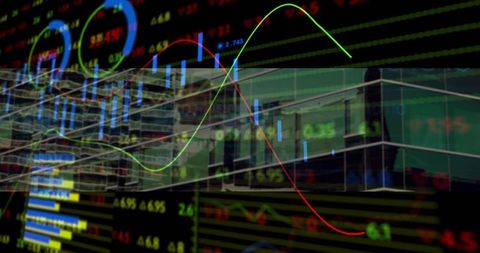
- Futuristic Data Visualization with Stock Tickers and Line Graphs
Futuristic Data Visualization with Stock Tickers and Line Graphs Image

Visualizing futuristic data with central graphic, wireframe corridor featuring line graphs and stock tickers. Perfect for finance, data analysis, or technology themes needing a modern representation. Useful in presentations, educational materials, or design projects focusing on innovation and digital analytics.
Powered by 


downloads
Tags:
More
Credit Photo
If you would like to credit the Photo, here are some ways you can do so
Text Link
photo Link
<span class="text-link">
<span>
<a target="_blank" href=https://pikwizard.com/photo/futuristic-data-visualization-with-stock-tickers-and-line-graphs/2a7beeab2aa622dfee8e4648201914a8/>PikWizard</a>
</span>
</span>
<span class="image-link">
<span
style="margin: 0 0 20px 0; display: inline-block; vertical-align: middle; width: 100%;"
>
<a
target="_blank"
href="https://pikwizard.com/photo/futuristic-data-visualization-with-stock-tickers-and-line-graphs/2a7beeab2aa622dfee8e4648201914a8/"
style="text-decoration: none; font-size: 10px; margin: 0;"
>
<img src="https://pikwizard.com/pw/medium/2a7beeab2aa622dfee8e4648201914a8.jpg" style="margin: 0; width: 100%;" alt="" />
<p style="font-size: 12px; margin: 0;">PikWizard</p>
</a>
</span>
</span>
Free (free of charge)
Free for personal and commercial use.
Author: Awesome Content
Similar Free Stock Images

Premium


Premium


Premium


Premium


Premium


Premium


Premium


Premium


Premium
Premium


Premium


Premium


Premium


Premium


Premium


Premium


Premium


Premium


Premium


Premium


Premium


Premium


Premium


Premium


Premium


Explore More Free Stock Images