
- Home >
- Stock Photos >
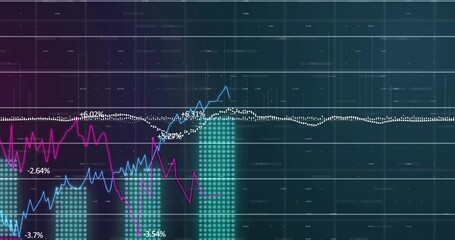
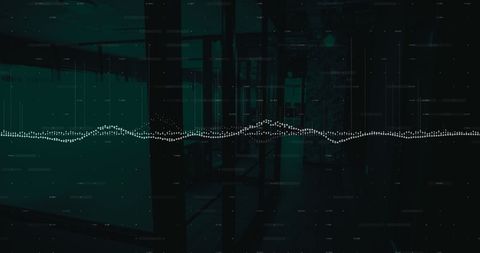
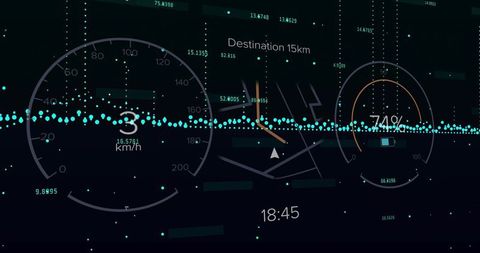
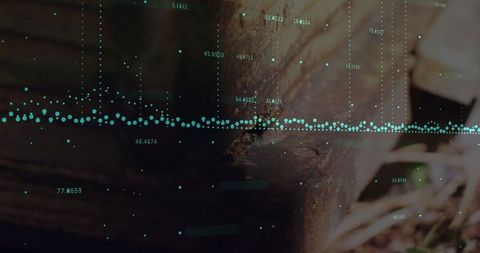
- Futuristic Data Visualization with Teal Dots in Motion
Futuristic Data Visualization with Teal Dots in Motion Image

Teal dots and bars spread across dark background depict dynamic data analytics. Ideal for presentations, technology content, and digital marketing materials to accentuate modern interfaces and analytics themes.
Powered by 


downloads
Tags:
More
Credit Photo
If you would like to credit the Photo, here are some ways you can do so
Text Link
photo Link
<span class="text-link">
<span>
<a target="_blank" href=https://pikwizard.com/photo/futuristic-data-visualization-with-teal-dots-in-motion/569ddaf78c890e527a7be98d7bdb896d/>PikWizard</a>
</span>
</span>
<span class="image-link">
<span
style="margin: 0 0 20px 0; display: inline-block; vertical-align: middle; width: 100%;"
>
<a
target="_blank"
href="https://pikwizard.com/photo/futuristic-data-visualization-with-teal-dots-in-motion/569ddaf78c890e527a7be98d7bdb896d/"
style="text-decoration: none; font-size: 10px; margin: 0;"
>
<img src="https://pikwizard.com/pw/medium/569ddaf78c890e527a7be98d7bdb896d.jpg" style="margin: 0; width: 100%;" alt="" />
<p style="font-size: 12px; margin: 0;">PikWizard</p>
</a>
</span>
</span>
Free (free of charge)
Free for personal and commercial use.
Author: People Creations
Similar Free Stock Images

Premium


Premium


Premium

Premium


Premium


Premium


Premium


Premium


Premium

Premium


Premium


Premium


Premium


Premium


Premium


Premium


Premium


Premium


Premium


Premium


Premium


Premium


Premium


Premium


Premium

Explore More Free Stock Images