- Home >
- Stock Photos >
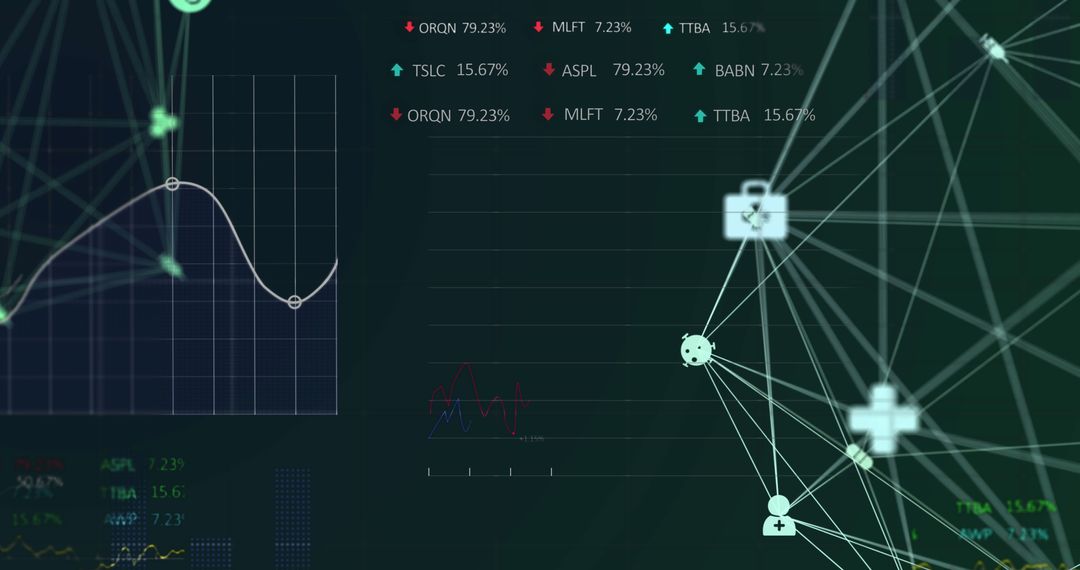
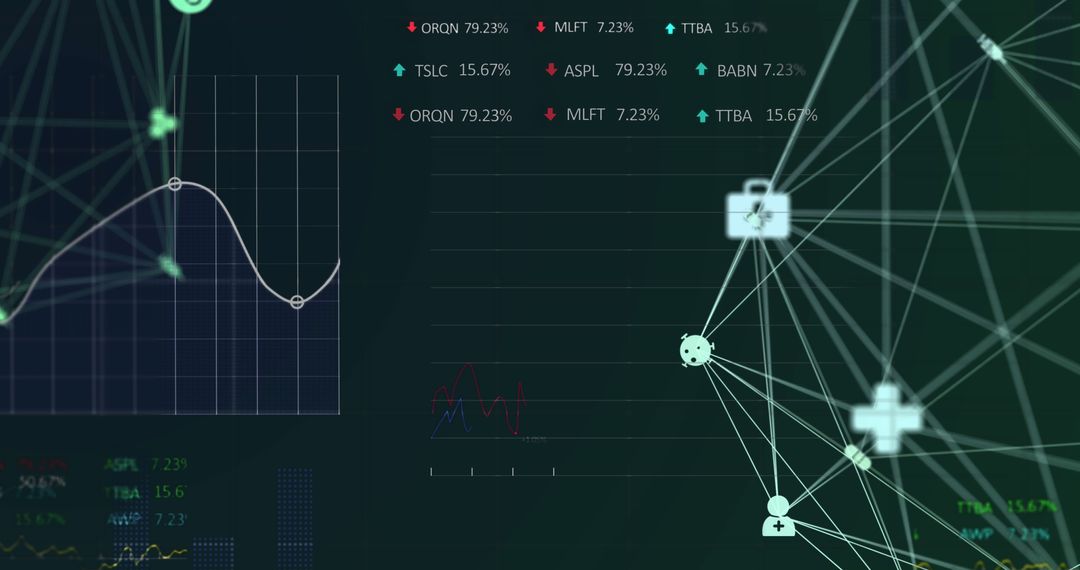
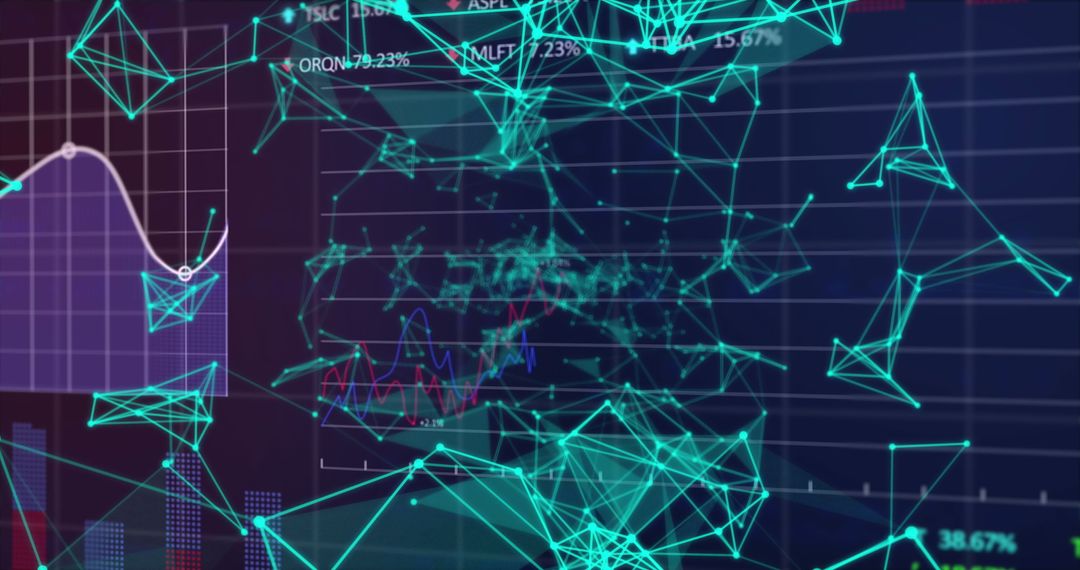
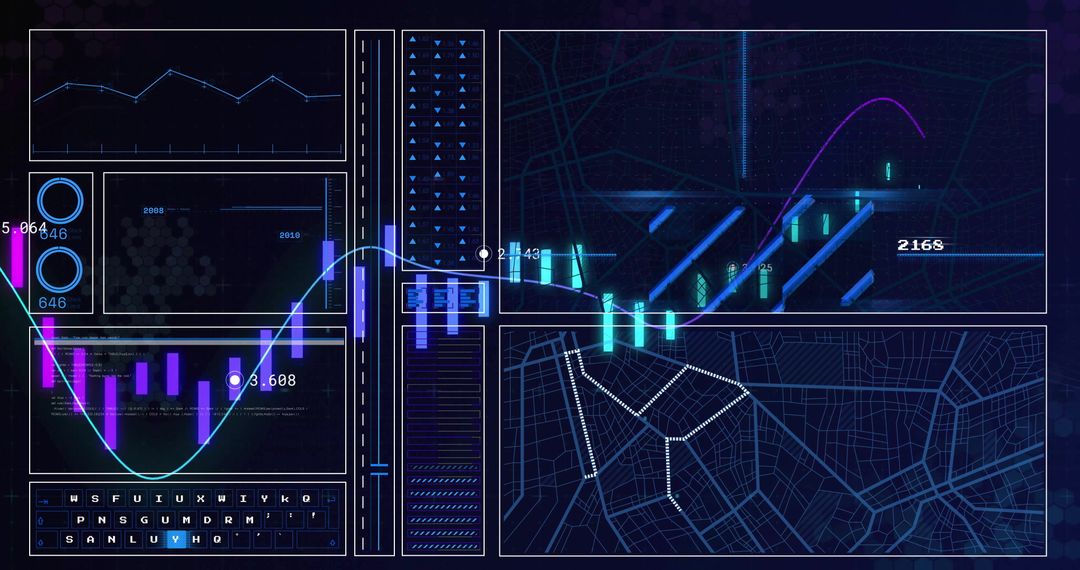
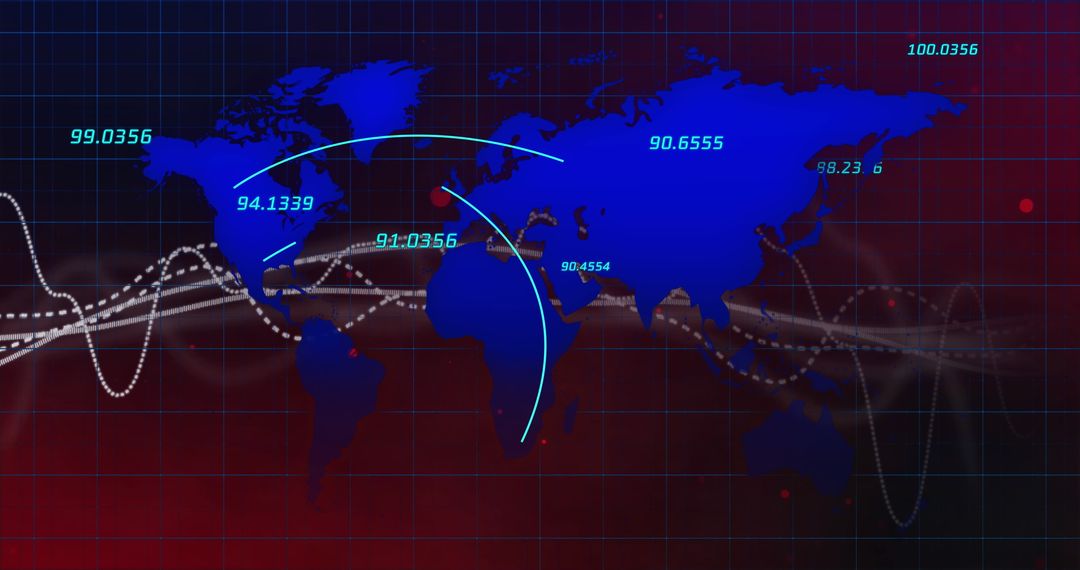
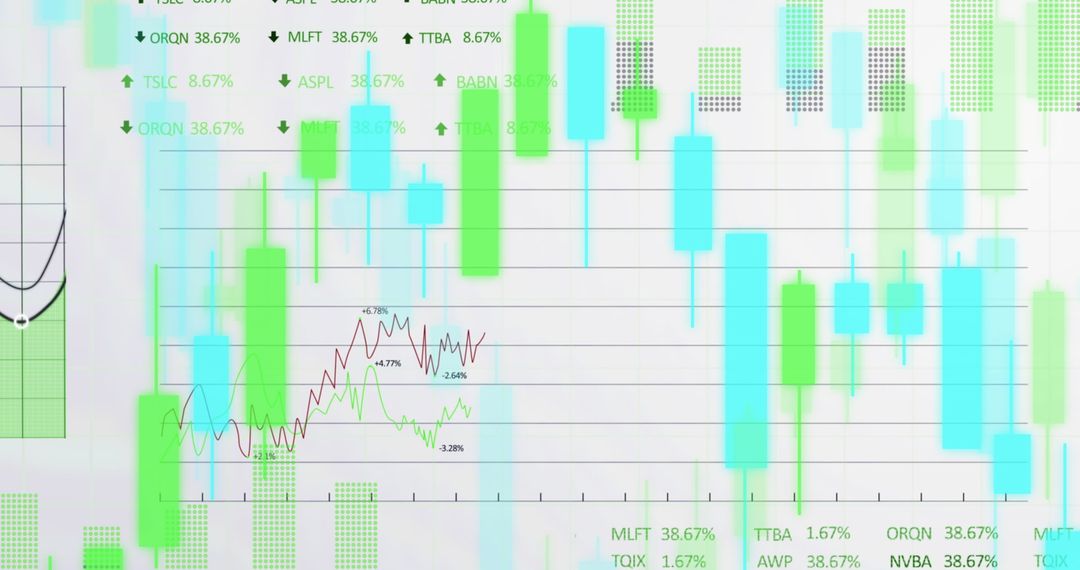
- Futuristic Data Visualization with Teal Nodes and Stock Charts
Futuristic Data Visualization with Teal Nodes and Stock Charts Image

This visual scene represents futuristic data analytics and digital network communications with teal nodes and lines interconnected on a grid. Integral charts and scrolling stock tickers highlight financial and technological themes. Ideal for illustrating themes of cybersecurity, financial analytics, technology innovations, and data-driven storytelling in presentations, editorial content, or tech articles.
Powered by 


0
downloads
downloads
Tags:
More
Credit Photo
If you would like to credit the Photo, here are some ways you can do so
Text Link
photo Link
<span class="text-link">
<span>
<a target="_blank" href=https://pikwizard.com/photo/futuristic-data-visualization-with-teal-nodes-and-stock-charts/6ffe56d24067f19c2603ac9da0311587/>PikWizard</a>
</span>
</span>
<span class="image-link">
<span
style="margin: 0 0 20px 0; display: inline-block; vertical-align: middle; width: 100%;"
>
<a
target="_blank"
href="https://pikwizard.com/photo/futuristic-data-visualization-with-teal-nodes-and-stock-charts/6ffe56d24067f19c2603ac9da0311587/"
style="text-decoration: none; font-size: 10px; margin: 0;"
>
<img src="https://pikwizard.com/pw/medium/6ffe56d24067f19c2603ac9da0311587.jpg" style="margin: 0; width: 100%;" alt="" />
<p style="font-size: 12px; margin: 0;">PikWizard</p>
</a>
</span>
</span>
Free (free of charge)
Free for personal and commercial use.
Author: Creative Art
Similar Free Stock Images

Premium


Premium


Premium


Premium


Premium


Premium


Premium


Premium


Premium


Premium


Premium


Premium


Premium


Premium


Premium


Premium


Premium


Premium


Premium


Premium


Premium


Premium


Premium


Premium