
- Home >
- Stock Photos >
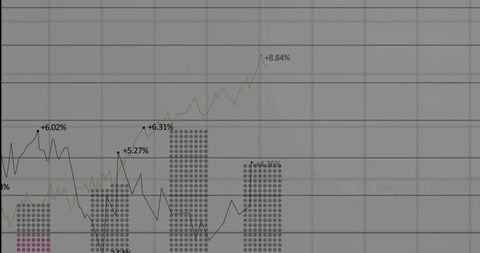
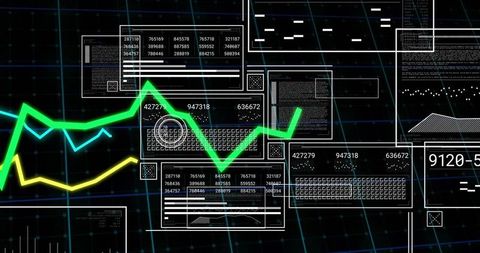
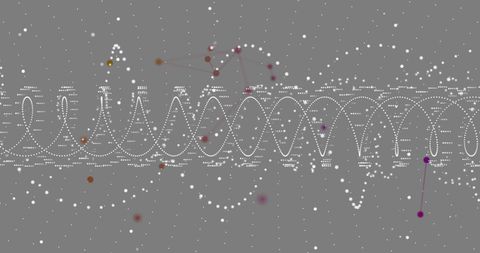
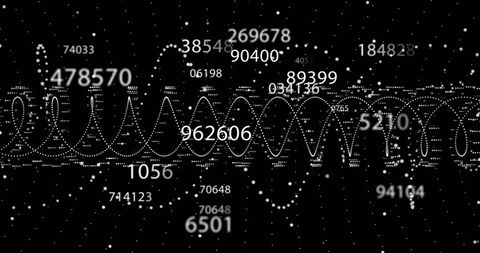
- Futuristic Data Visualization with Time Trends
Futuristic Data Visualization with Time Trends Image
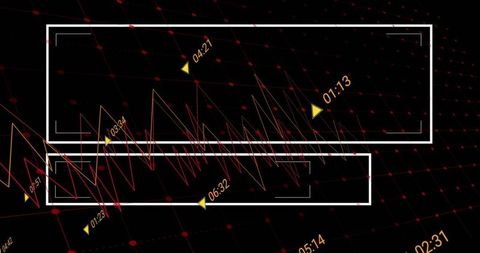
Dynamic representation of time-stamped data using luminous graphs and points, offering high tech vibe. Suitable for illustrating finance data, digital analytics projects, or upcoming tech innovations. Can be used in presentations, educational material on data analysis, and innovative projects.
Powered by  - Get 15% off with code: PIKWIZARD15


downloads
Tags:
More
Credit Photo
If you would like to credit the Photo, here are some ways you can do so
Text Link
photo Link
<span class="text-link">
<span>
<a target="_blank" href=https://pikwizard.com/photo/futuristic-data-visualization-with-time-trends/14b429a790ba4611161b507ee5a4df5b/>PikWizard</a>
</span>
</span>
<span class="image-link">
<span
style="margin: 0 0 20px 0; display: inline-block; vertical-align: middle; width: 100%;"
>
<a
target="_blank"
href="https://pikwizard.com/photo/futuristic-data-visualization-with-time-trends/14b429a790ba4611161b507ee5a4df5b/"
style="text-decoration: none; font-size: 10px; margin: 0;"
>
<img src="https://pikwizard.com/pw/medium/14b429a790ba4611161b507ee5a4df5b.jpg" style="margin: 0; width: 100%;" alt="" />
<p style="font-size: 12px; margin: 0;">PikWizard</p>
</a>
</span>
</span>
Free (free of charge)
Free for personal and commercial use.
Author: People Creations
Similar Free Stock Images

Premium


Premium


Premium


Premium


Premium


Premium


Premium


Premium


Premium


Premium


Premium


Premium


Premium


Premium

Premium


Premium


Premium

Premium

Premium


Premium


Premium


Premium


Premium


Premium

Premium


Explore More Free Stock Images