- Home >
- Stock Photos >
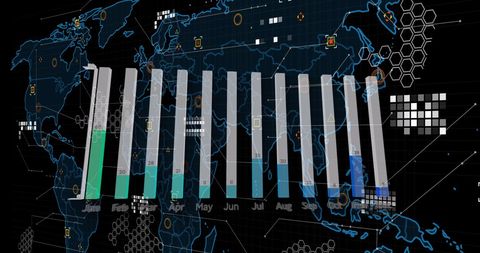
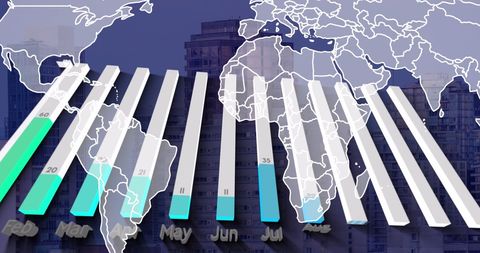
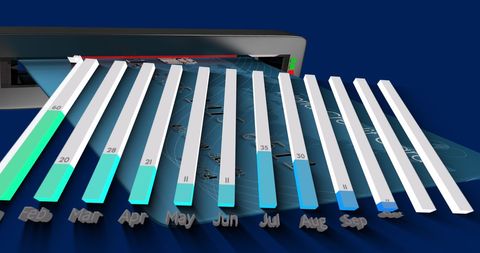
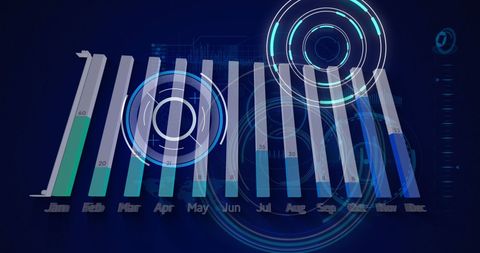
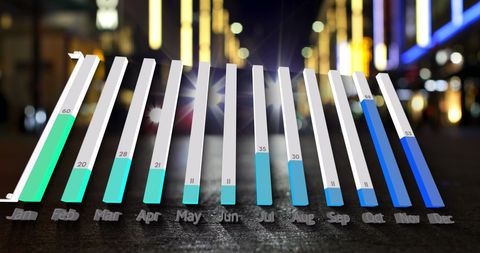
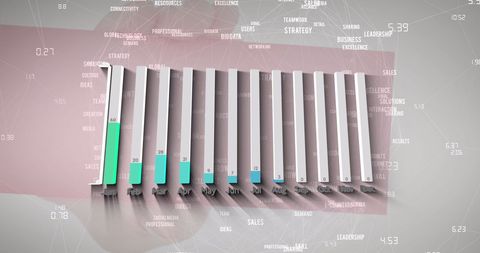
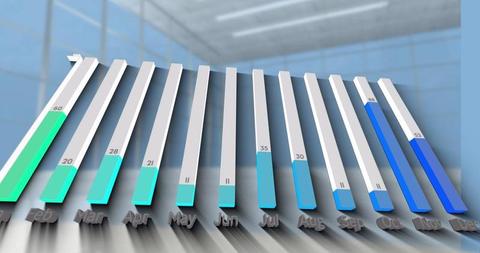
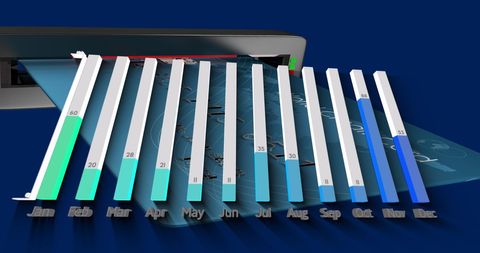
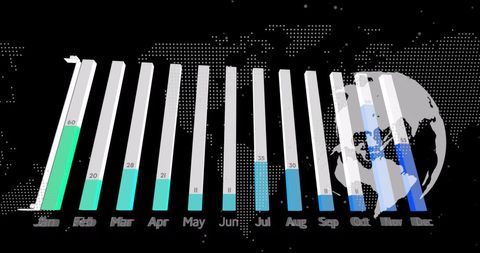
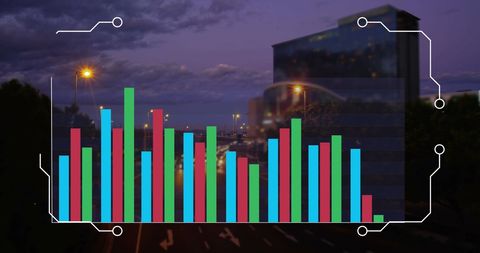
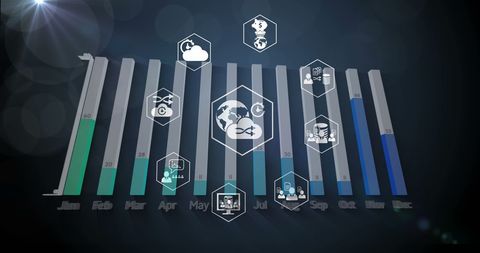
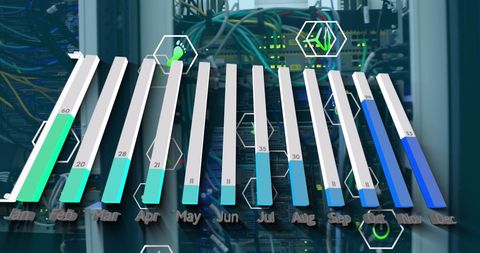
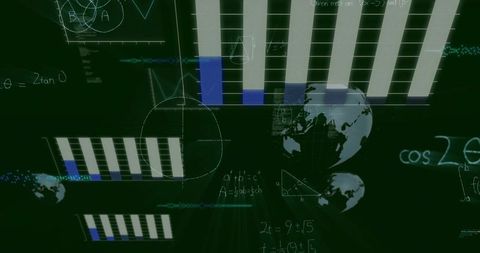
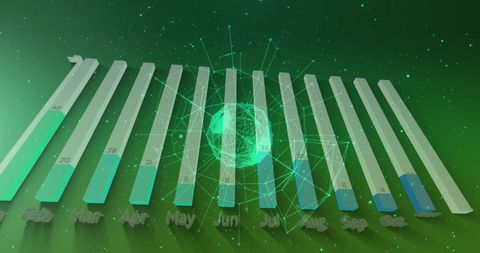
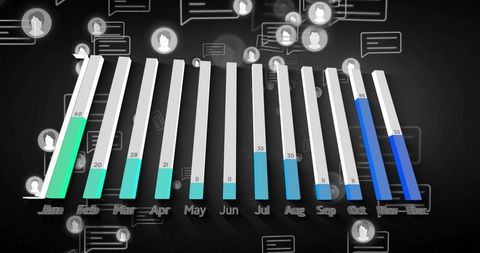
- Futuristic Data Visualization with Timeline and Graph
Futuristic Data Visualization with Timeline and Graph Image

Abstract visualization features digital timeline and data columns over network of connections. Vibrant graph elements highlight futuristic technology, useful for illustrating concepts in global information processing, data analysis trends, or modern telecommunication advancements.

downloads
Tags:
More
Credit Photo
If you would like to credit the Photo, here are some ways you can do so
Text Link
photo Link
<span class="text-link">
<span>
<a target="_blank" href=https://pikwizard.com/photo/futuristic-data-visualization-with-timeline-and-graph/d67a2ff2c77e9ffc533c1287d3f79b8b/>PikWizard</a>
</span>
</span>
<span class="image-link">
<span
style="margin: 0 0 20px 0; display: inline-block; vertical-align: middle; width: 100%;"
>
<a
target="_blank"
href="https://pikwizard.com/photo/futuristic-data-visualization-with-timeline-and-graph/d67a2ff2c77e9ffc533c1287d3f79b8b/"
style="text-decoration: none; font-size: 10px; margin: 0;"
>
<img src="https://pikwizard.com/pw/medium/d67a2ff2c77e9ffc533c1287d3f79b8b.jpg" style="margin: 0; width: 100%;" alt="" />
<p style="font-size: 12px; margin: 0;">PikWizard</p>
</a>
</span>
</span>
Free (free of charge)
Free for personal and commercial use.
Author: Awesome Content