
- Home >
- Stock Photos >
- Futuristic Data Visualization with Trading Analytics and Cutting-Edge Interface
Futuristic Data Visualization with Trading Analytics and Cutting-Edge Interface Image
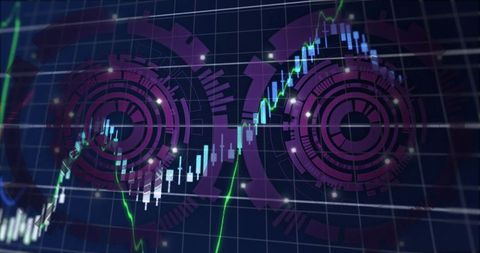
Futuristic trading screen displays detailed financial analytics. Key features include neon green line graph, candlesticks and digital circular interfaces, emphasizing advanced technology and data analysis capabilities. Useful for website banners, tech articles, blog posts on finance and tutorials about market analysis tools.
Powered by 


downloads
Tags:
More
Credit Photo
If you would like to credit the Photo, here are some ways you can do so
Text Link
photo Link
<span class="text-link">
<span>
<a target="_blank" href=https://pikwizard.com/photo/futuristic-data-visualization-with-trading-analytics-and-cutting-edge-interface/8506383ecc656539096701713a9cf647/>PikWizard</a>
</span>
</span>
<span class="image-link">
<span
style="margin: 0 0 20px 0; display: inline-block; vertical-align: middle; width: 100%;"
>
<a
target="_blank"
href="https://pikwizard.com/photo/futuristic-data-visualization-with-trading-analytics-and-cutting-edge-interface/8506383ecc656539096701713a9cf647/"
style="text-decoration: none; font-size: 10px; margin: 0;"
>
<img src="https://pikwizard.com/pw/medium/8506383ecc656539096701713a9cf647.jpg" style="margin: 0; width: 100%;" alt="" />
<p style="font-size: 12px; margin: 0;">PikWizard</p>
</a>
</span>
</span>
Free (free of charge)
Free for personal and commercial use.
Author: Awesome Content