
- Home >
- Stock Photos >
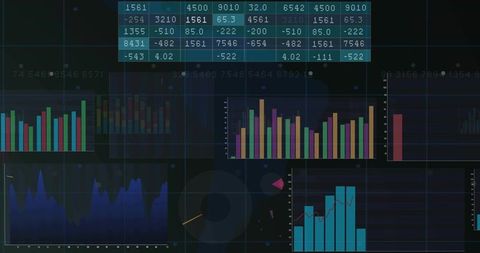
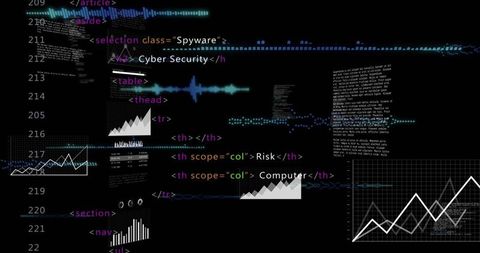
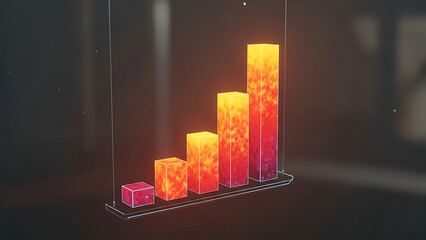
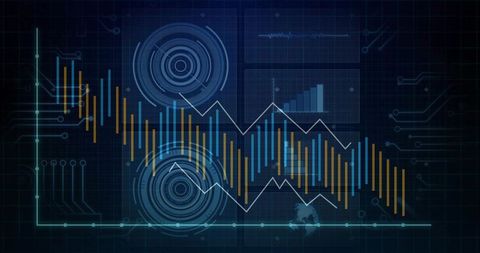
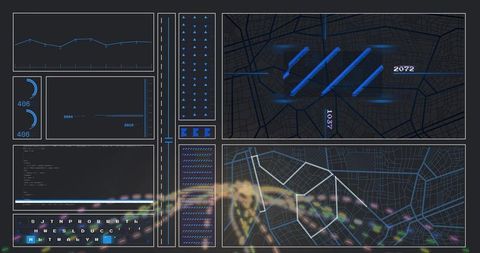
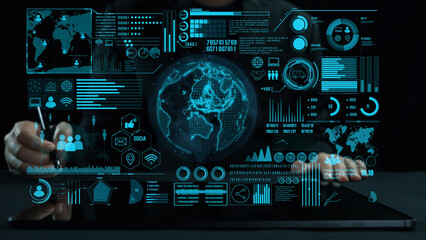
- Futuristic Data Visualization with Vertical Bar Charts
Futuristic Data Visualization with Vertical Bar Charts Image

Dynamic futuristic design incorporating vertical bar charts and trend lines on a complex digital interface. Excellent for illustrating concepts related to data analytics, financial markets, technology trends, and futurism. Can be used in presentations, tech industry animations, and for product visualization requiring a modern, tech-savvy aesthetic.
Powered by 


downloads
Tags:
More
Credit Photo
If you would like to credit the Photo, here are some ways you can do so
Text Link
photo Link
<span class="text-link">
<span>
<a target="_blank" href=https://pikwizard.com/photo/futuristic-data-visualization-with-vertical-bar-charts/bdc9cf25fa0eae7901551e99e24684de/>PikWizard</a>
</span>
</span>
<span class="image-link">
<span
style="margin: 0 0 20px 0; display: inline-block; vertical-align: middle; width: 100%;"
>
<a
target="_blank"
href="https://pikwizard.com/photo/futuristic-data-visualization-with-vertical-bar-charts/bdc9cf25fa0eae7901551e99e24684de/"
style="text-decoration: none; font-size: 10px; margin: 0;"
>
<img src="https://pikwizard.com/pw/medium/bdc9cf25fa0eae7901551e99e24684de.jpg" style="margin: 0; width: 100%;" alt="" />
<p style="font-size: 12px; margin: 0;">PikWizard</p>
</a>
</span>
</span>
Free (free of charge)
Free for personal and commercial use.
Author: People Creations
Similar Free Stock Images

Premium


Premium


Premium


Premium


Premium


Premium


Premium

Premium

Premium


Premium


Premium


Premium


Premium
Premium


Premium

Premium


Premium


Premium

Premium


Premium


Premium


Premium


Premium


Premium


Premium
Explore More Free Stock Images