- Home >
- Stock Photos >
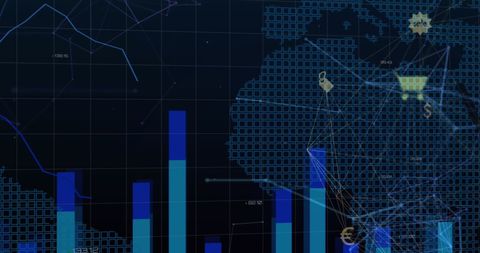
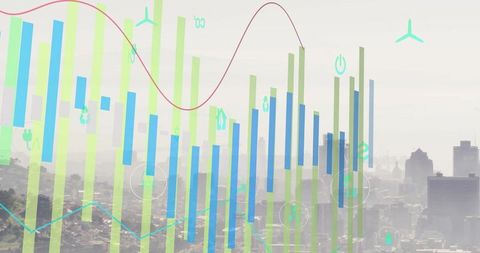
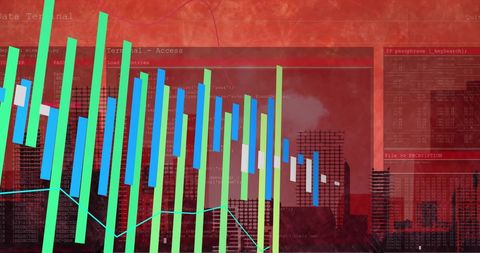
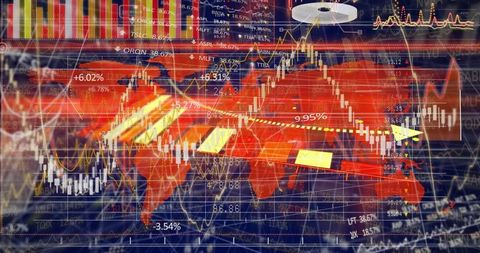
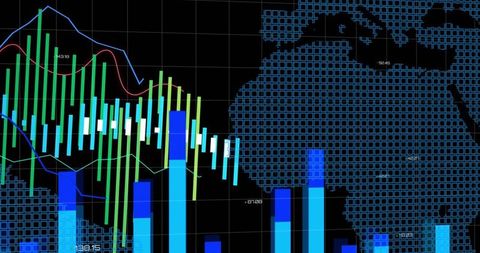
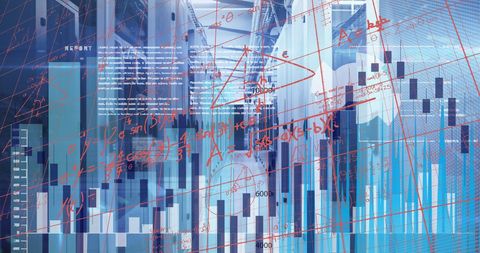
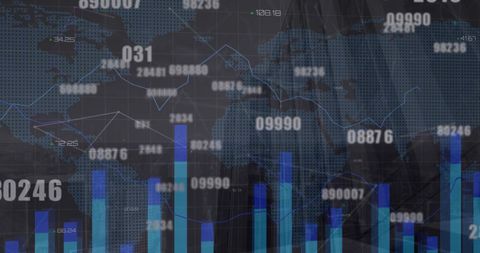
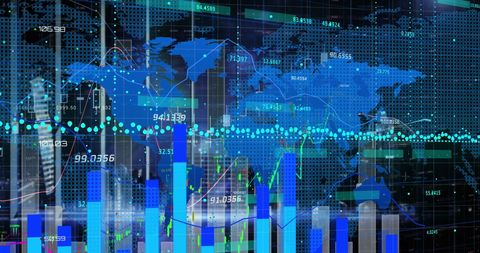
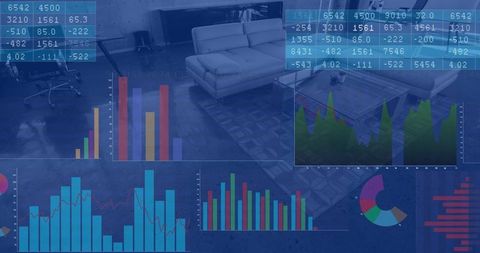
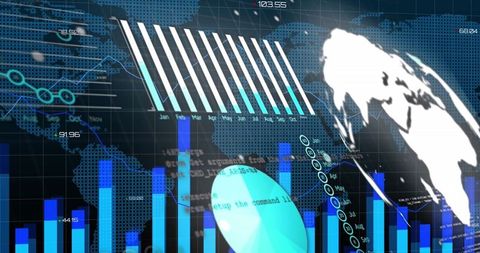
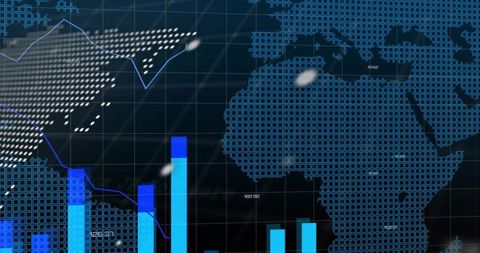
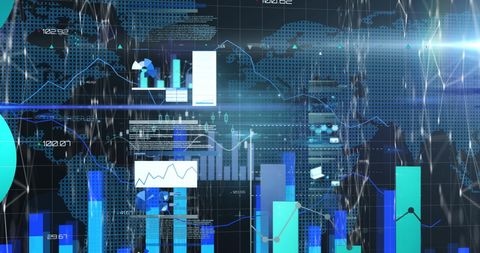
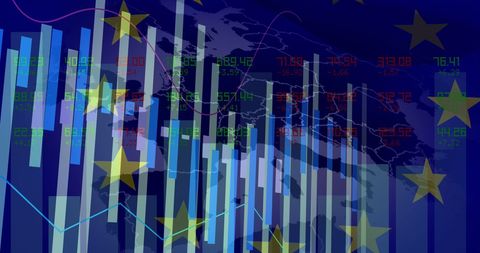
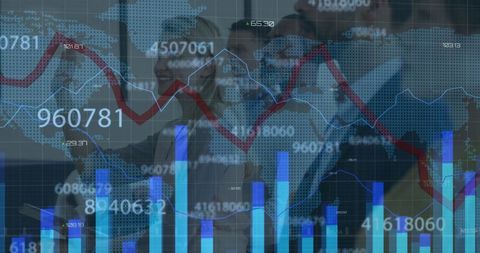
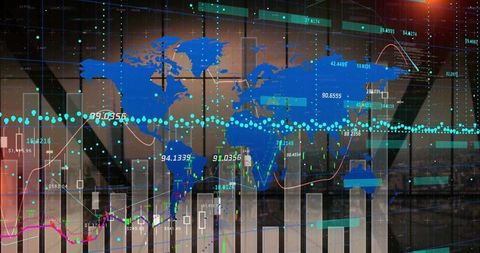
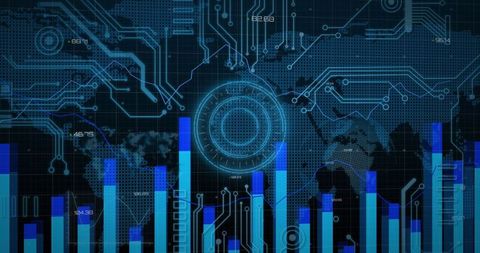
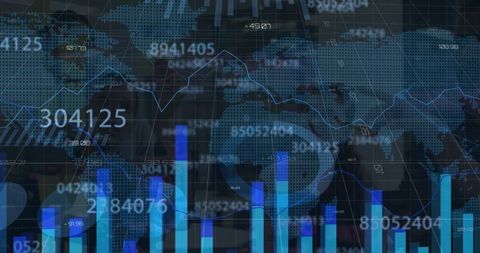
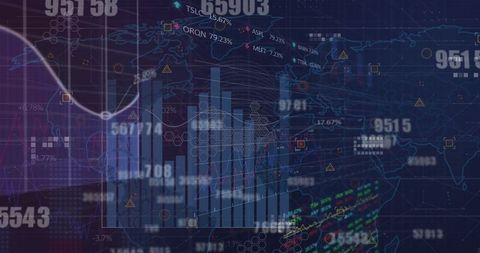
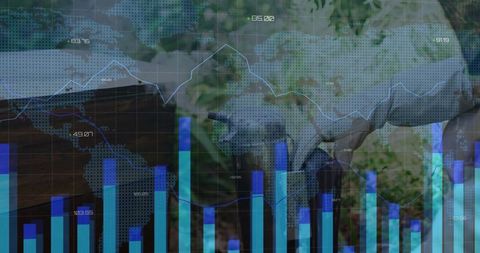
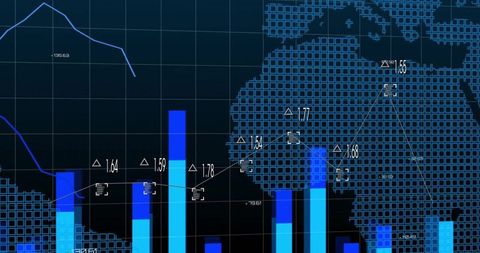
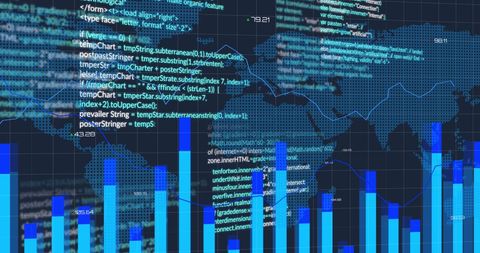
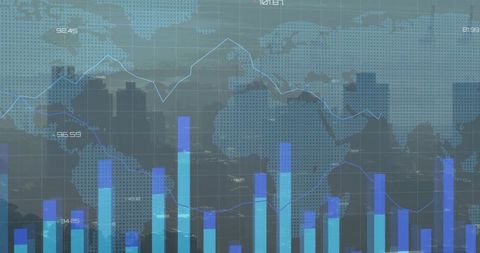
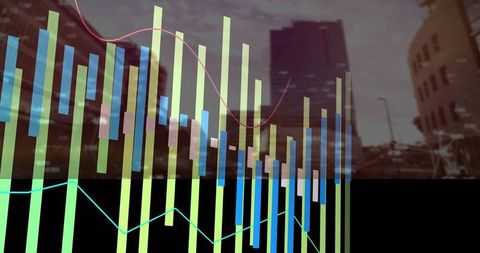
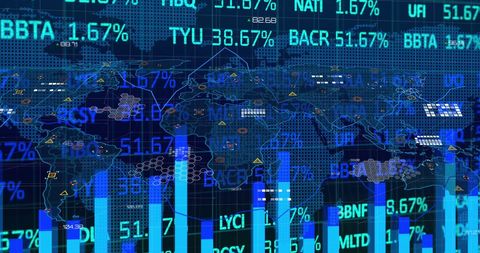
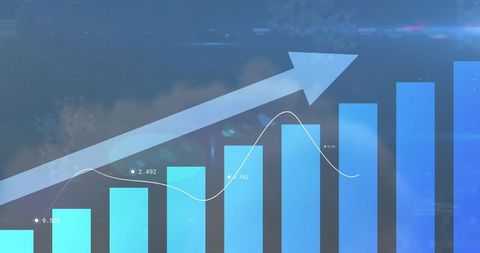
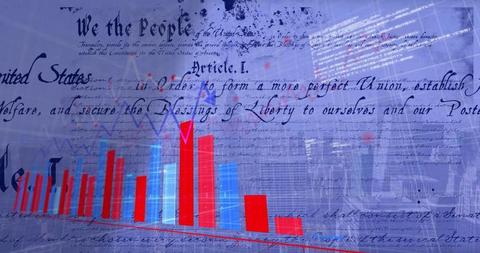
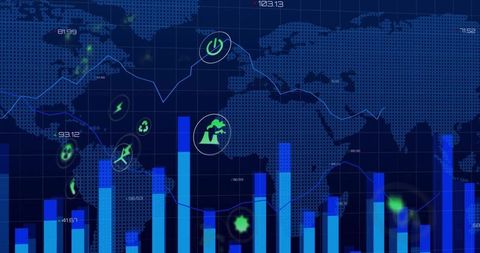
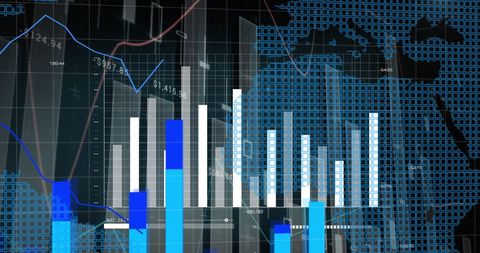
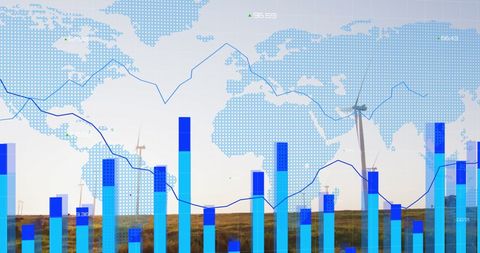
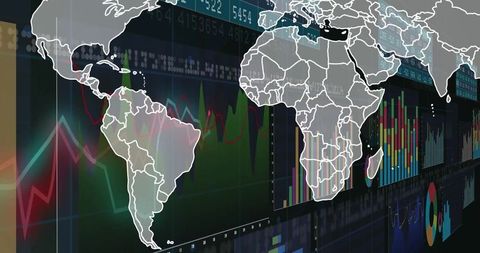
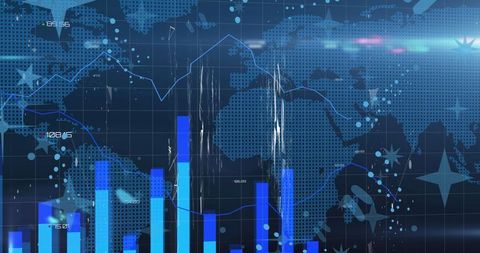
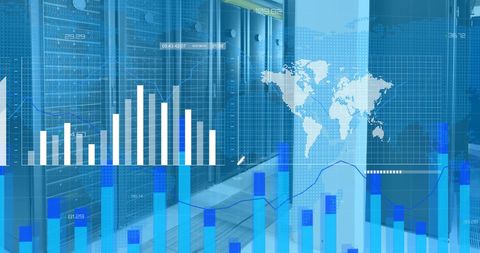
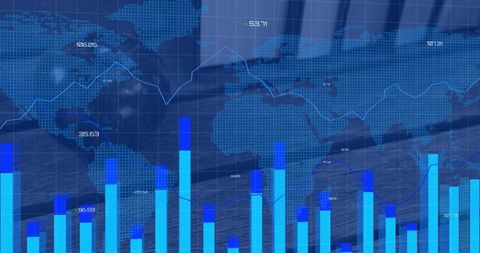
- Futuristic Digital Analytics and Global Financial Data Visualization
Futuristic Digital Analytics and Global Financial Data Visualization Image
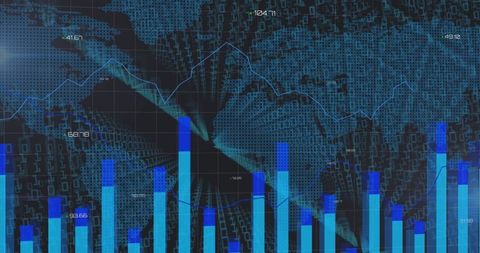
Featuring digital graphs and statistics overlaid on a map, this image represents global connectivity through analytics and data visualization. It conveys complex data interactions of international finance or business network concepts. Ideal for presentations on global economics, technology websites, or digital transformation materials.

downloads
Tags:
More
Credit Photo
If you would like to credit the Photo, here are some ways you can do so
Text Link
photo Link
<span class="text-link">
<span>
<a target="_blank" href=https://pikwizard.com/photo/futuristic-digital-analytics-and-global-financial-data-visualization/3d7333c8540ed582c04a8c123cf88f08/>PikWizard</a>
</span>
</span>
<span class="image-link">
<span
style="margin: 0 0 20px 0; display: inline-block; vertical-align: middle; width: 100%;"
>
<a
target="_blank"
href="https://pikwizard.com/photo/futuristic-digital-analytics-and-global-financial-data-visualization/3d7333c8540ed582c04a8c123cf88f08/"
style="text-decoration: none; font-size: 10px; margin: 0;"
>
<img src="https://pikwizard.com/pw/medium/3d7333c8540ed582c04a8c123cf88f08.jpg" style="margin: 0; width: 100%;" alt="" />
<p style="font-size: 12px; margin: 0;">PikWizard</p>
</a>
</span>
</span>
Free (free of charge)
Free for personal and commercial use.
Author: People Creations