- Home >
- Stock Photos >
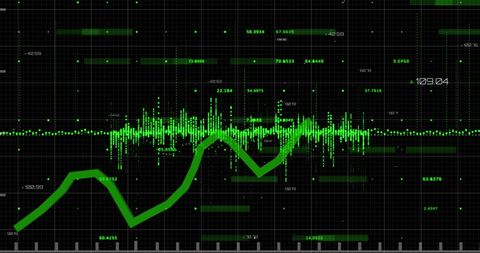
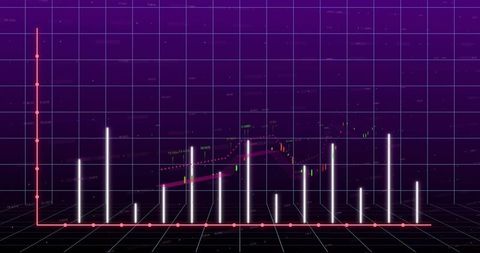
- Futuristic Digital Analytics Chart with Code Overlay
Futuristic Digital Analytics Chart with Code Overlay Image

Featuring futuristic digital analytics with code overlay, this image shows current data trends using contrasting orange and light blue bars. Ideal for use in technology presentations, data science articles, or as a visual element on finance and analytics platforms to convey data visualization topics effectively.

downloads
Tags:
More
Credit Photo
If you would like to credit the Photo, here are some ways you can do so
Text Link
photo Link
<span class="text-link">
<span>
<a target="_blank" href=https://pikwizard.com/photo/futuristic-digital-analytics-chart-with-code-overlay/f764f90bd5badf8d1f35372f8b65833d/>PikWizard</a>
</span>
</span>
<span class="image-link">
<span
style="margin: 0 0 20px 0; display: inline-block; vertical-align: middle; width: 100%;"
>
<a
target="_blank"
href="https://pikwizard.com/photo/futuristic-digital-analytics-chart-with-code-overlay/f764f90bd5badf8d1f35372f8b65833d/"
style="text-decoration: none; font-size: 10px; margin: 0;"
>
<img src="https://pikwizard.com/pw/medium/f764f90bd5badf8d1f35372f8b65833d.jpg" style="margin: 0; width: 100%;" alt="" />
<p style="font-size: 12px; margin: 0;">PikWizard</p>
</a>
</span>
</span>
Free (free of charge)
Free for personal and commercial use.
Author: People Creations