
- Home >
- Stock Photos >
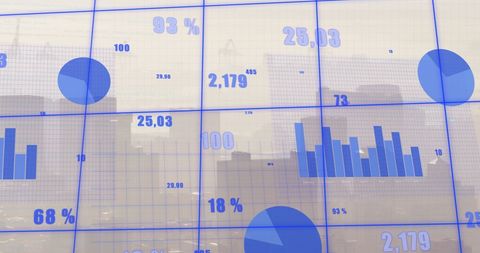
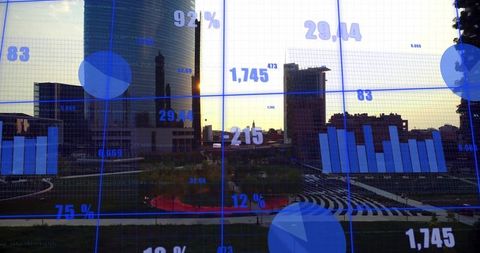
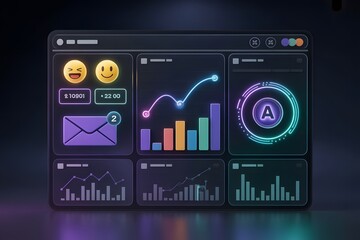
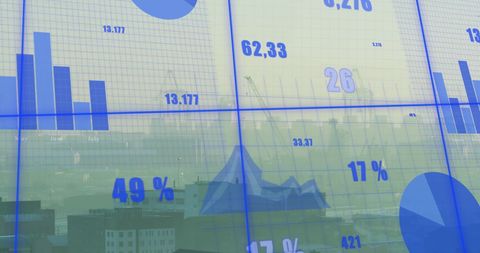
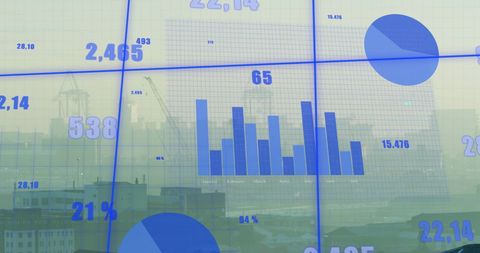
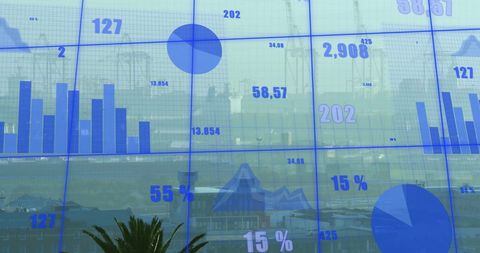
- Futuristic Digital Analytics Dashboard Display with Data Visualization
Futuristic Digital Analytics Dashboard Display with Data Visualization Image

Dashboard display integrating multiple data points including pie charts and bar charts overlayed with numerical figures in a futuristic, grid-based interface appealing to high-tech industries. Ideal for editorial content on data-driven decision making, innovation in data visualization, and technological advancements.
Powered by 


downloads
Tags:
More
Credit Photo
If you would like to credit the Photo, here are some ways you can do so
Text Link
photo Link
<span class="text-link">
<span>
<a target="_blank" href=https://pikwizard.com/photo/futuristic-digital-analytics-dashboard-display-with-data-visualization/d0c6b147e5fe039118bf0b15c1943694/>PikWizard</a>
</span>
</span>
<span class="image-link">
<span
style="margin: 0 0 20px 0; display: inline-block; vertical-align: middle; width: 100%;"
>
<a
target="_blank"
href="https://pikwizard.com/photo/futuristic-digital-analytics-dashboard-display-with-data-visualization/d0c6b147e5fe039118bf0b15c1943694/"
style="text-decoration: none; font-size: 10px; margin: 0;"
>
<img src="https://pikwizard.com/pw/medium/d0c6b147e5fe039118bf0b15c1943694.jpg" style="margin: 0; width: 100%;" alt="" />
<p style="font-size: 12px; margin: 0;">PikWizard</p>
</a>
</span>
</span>
Free (free of charge)
Free for personal and commercial use.
Author: Authentic Images
Similar Free Stock Images

Premium


Premium


Premium


Premium


Premium


Premium


Premium

Premium


Premium


Premium


Premium


Premium


Premium


Premium

Premium
Premium


Premium


Premium


Premium


Premium


Premium


Premium


Premium


Premium


Premium


Explore More Free Stock Images