
- Home >
- Stock Photos >
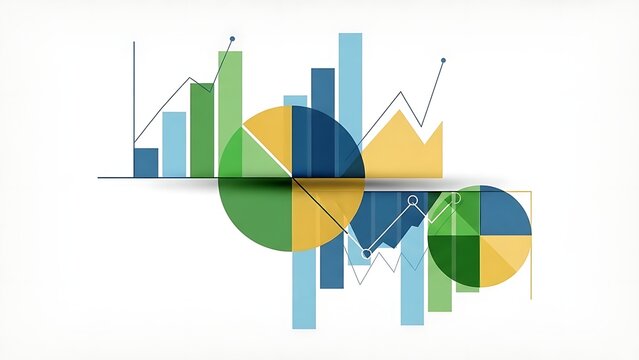
- Futuristic Digital Analytics Dashboard with Globe
Futuristic Digital Analytics Dashboard with Globe Image

Futuristic digital dashboard displaying complex analytics with colorful bar charts and line graphs overlaid by a digital globe made of dots. Ideal for presentations or websites focused on technology, data analysis, innovation, digital marketing, business strategy, and software development. This image represents modern analytics and technological advances that integrate data in global context. Perfect for illustrating articles on data trends and business intelligence.
Powered by 


downloads
Tags:
More
Credit Photo
If you would like to credit the Photo, here are some ways you can do so
Text Link
photo Link
<span class="text-link">
<span>
<a target="_blank" href=https://pikwizard.com/photo/futuristic-digital-analytics-dashboard-with-globe/43be7368f8ed17b02c784a6c44f55fac/>PikWizard</a>
</span>
</span>
<span class="image-link">
<span
style="margin: 0 0 20px 0; display: inline-block; vertical-align: middle; width: 100%;"
>
<a
target="_blank"
href="https://pikwizard.com/photo/futuristic-digital-analytics-dashboard-with-globe/43be7368f8ed17b02c784a6c44f55fac/"
style="text-decoration: none; font-size: 10px; margin: 0;"
>
<img src="https://pikwizard.com/pw/medium/43be7368f8ed17b02c784a6c44f55fac.jpg" style="margin: 0; width: 100%;" alt="" />
<p style="font-size: 12px; margin: 0;">PikWizard</p>
</a>
</span>
</span>
Free (free of charge)
Free for personal and commercial use.
Author: People Creations
Similar Free Stock Images

Premium


Premium
Premium


Premium


Premium


Premium


Premium


Premium

Premium


Premium

Premium

Premium


Premium


Premium


Premium


Premium


Premium


Premium


Premium


Premium


Premium


Premium


Premium


Premium


Premium


Explore More Free Stock Images