
- Home >
- Stock Photos >
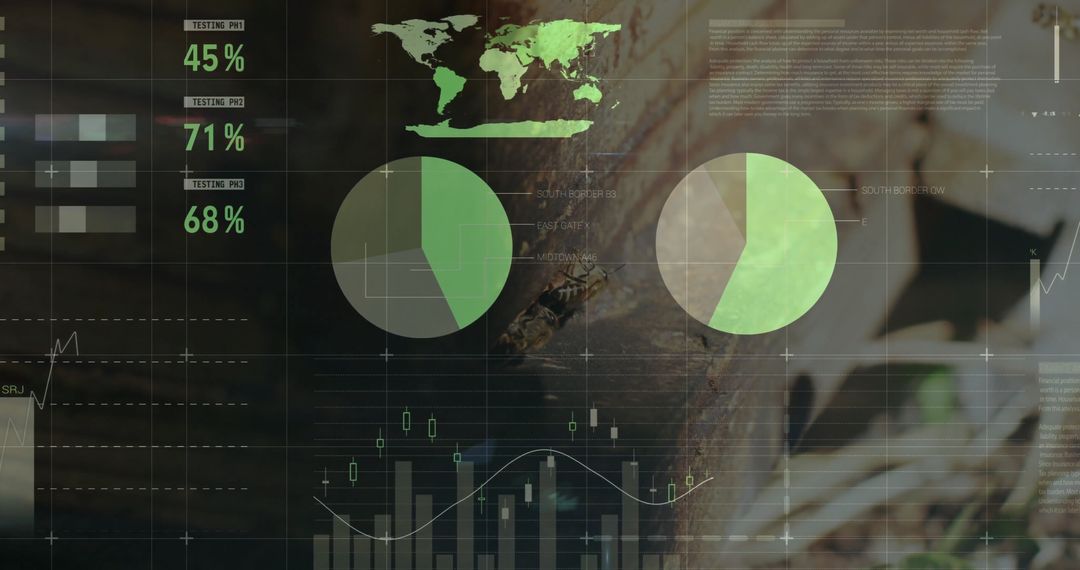
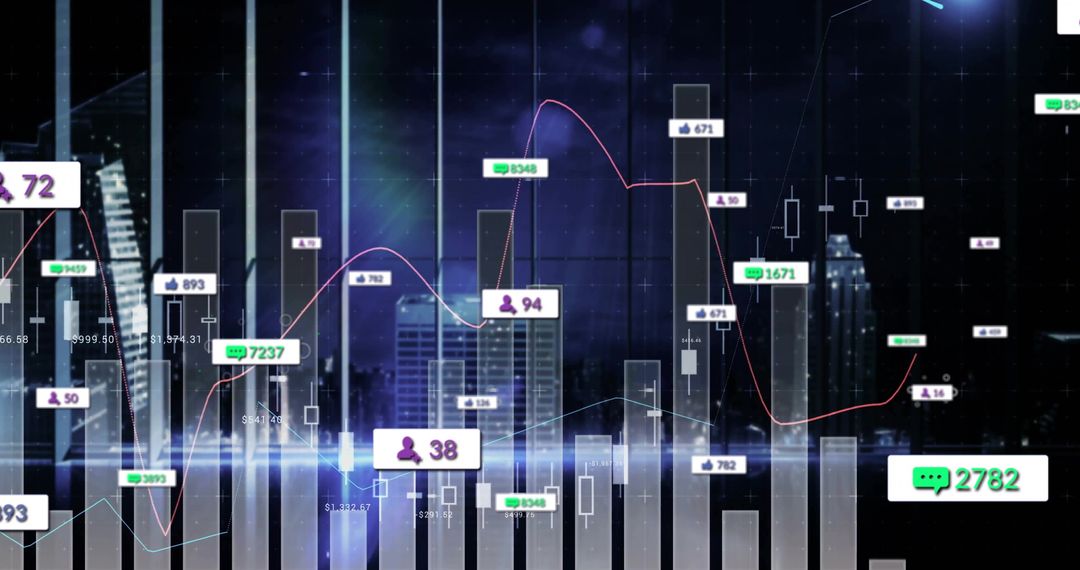
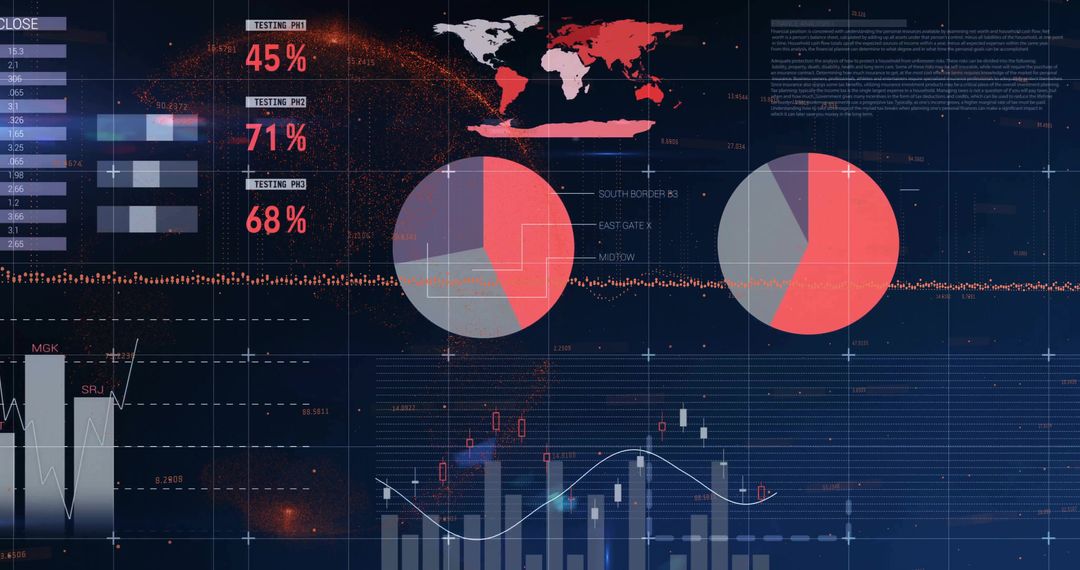
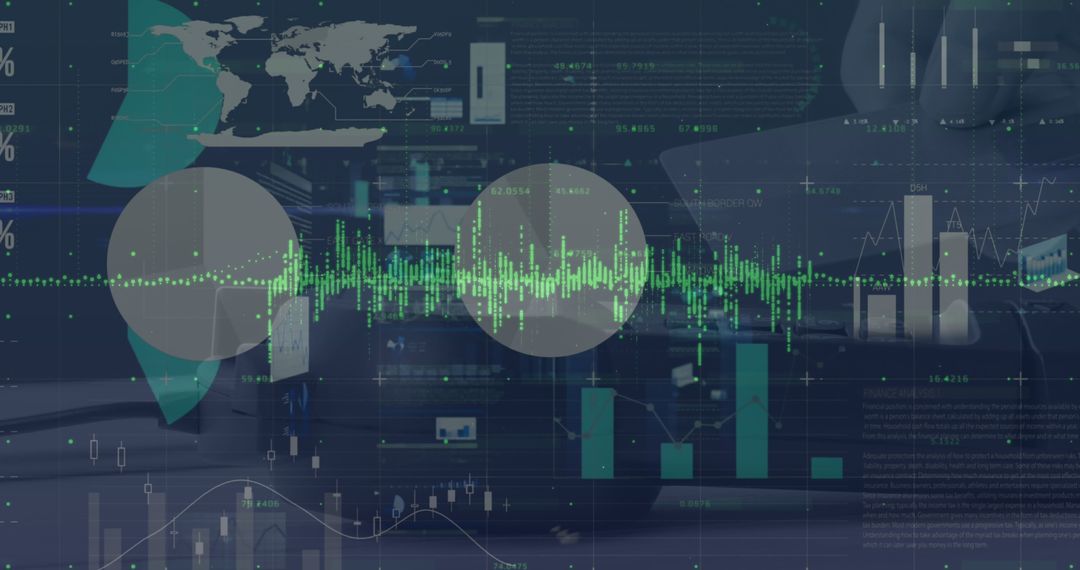
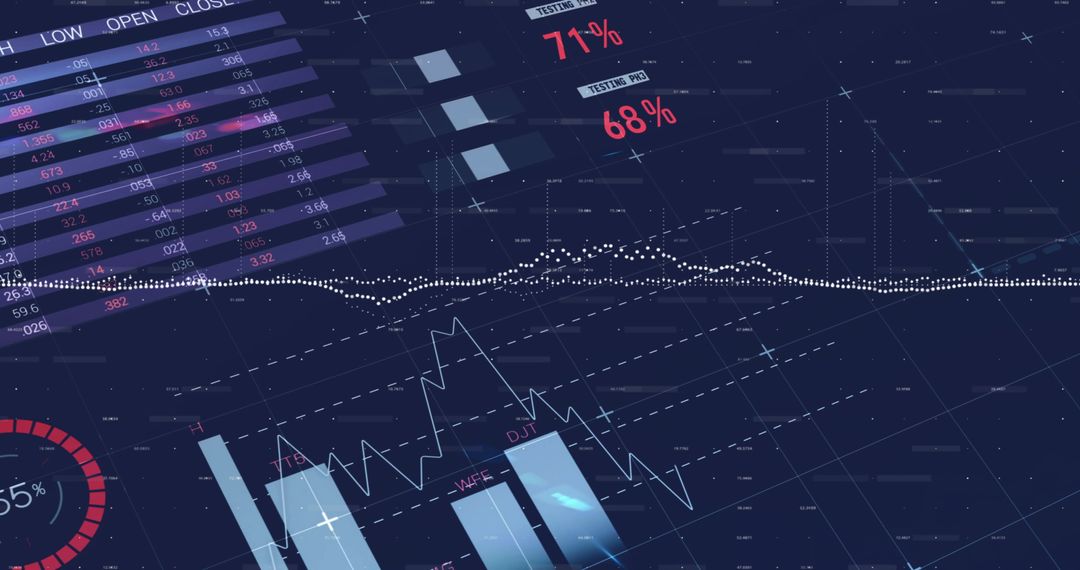
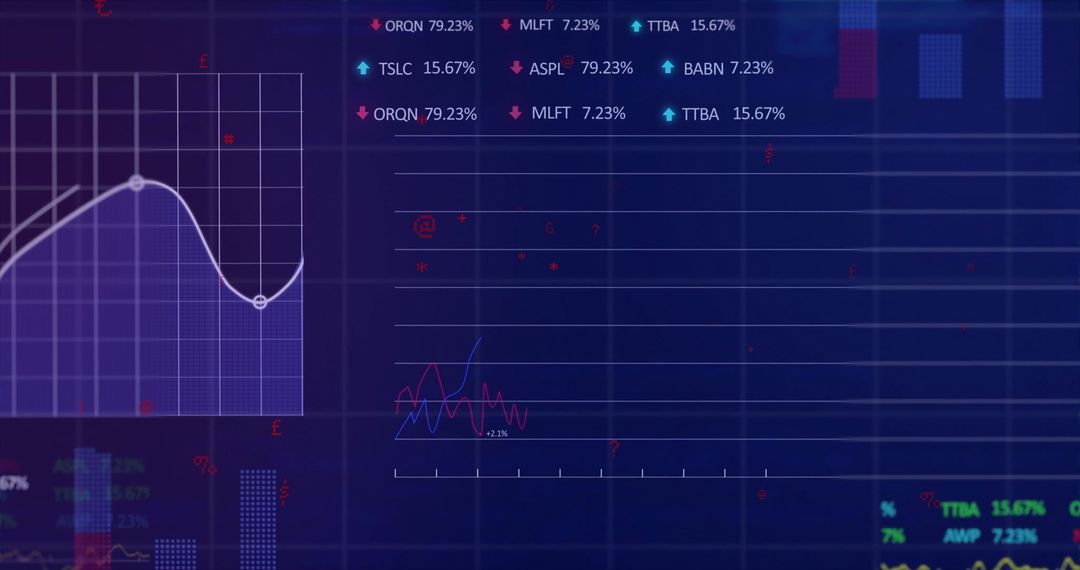
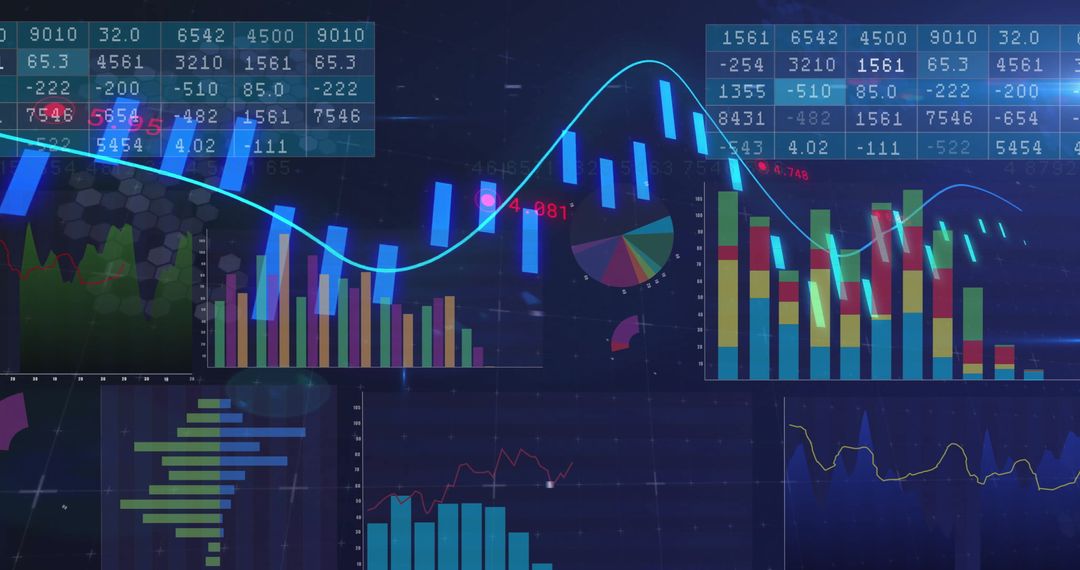
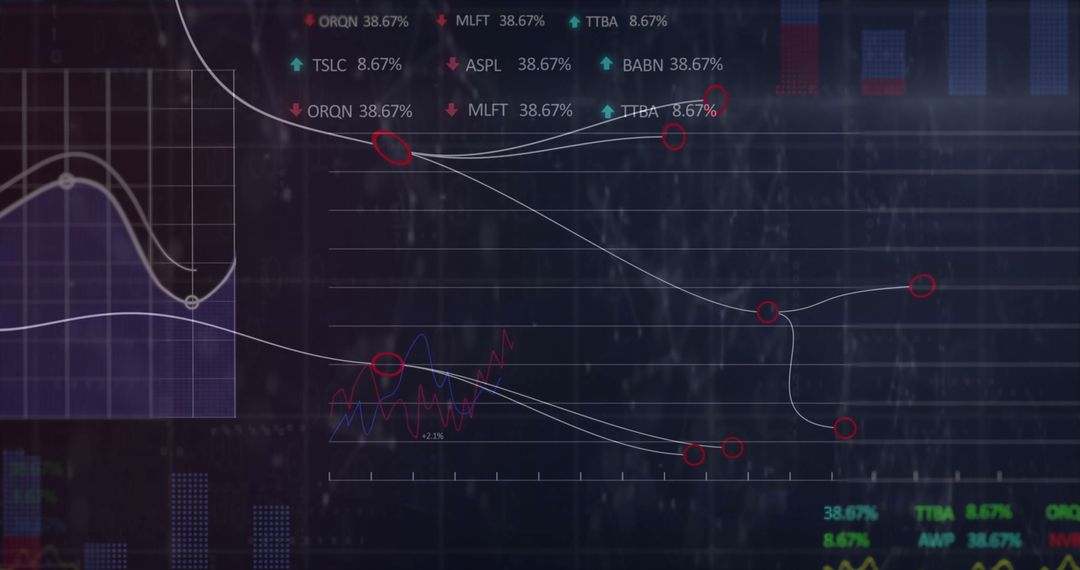
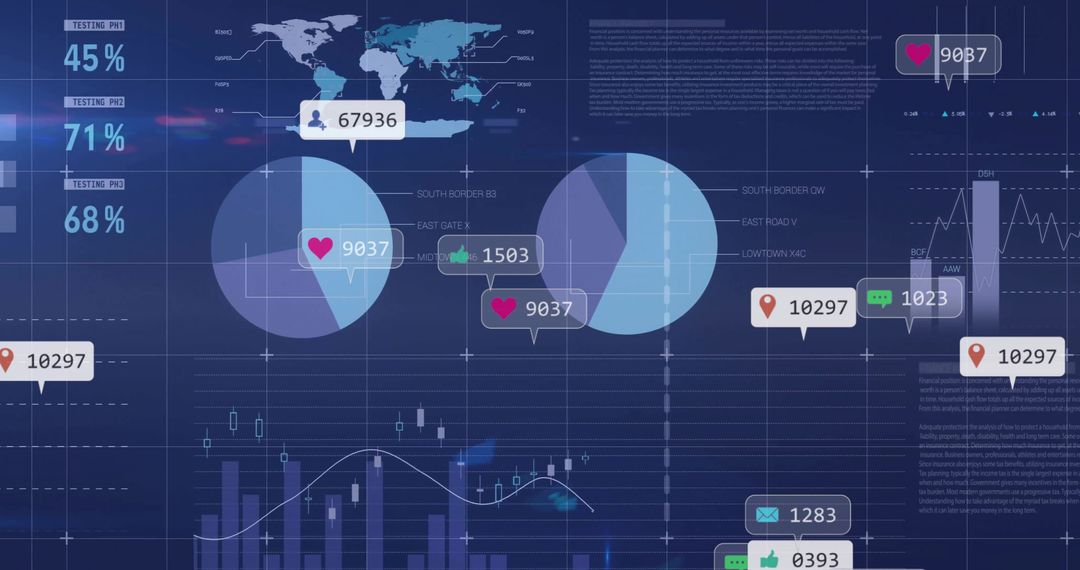
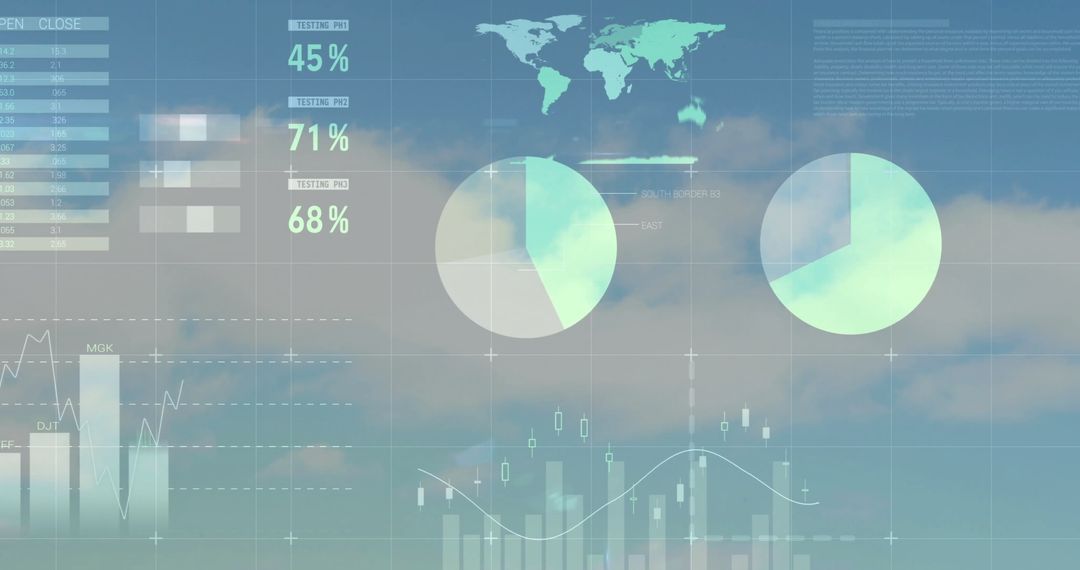
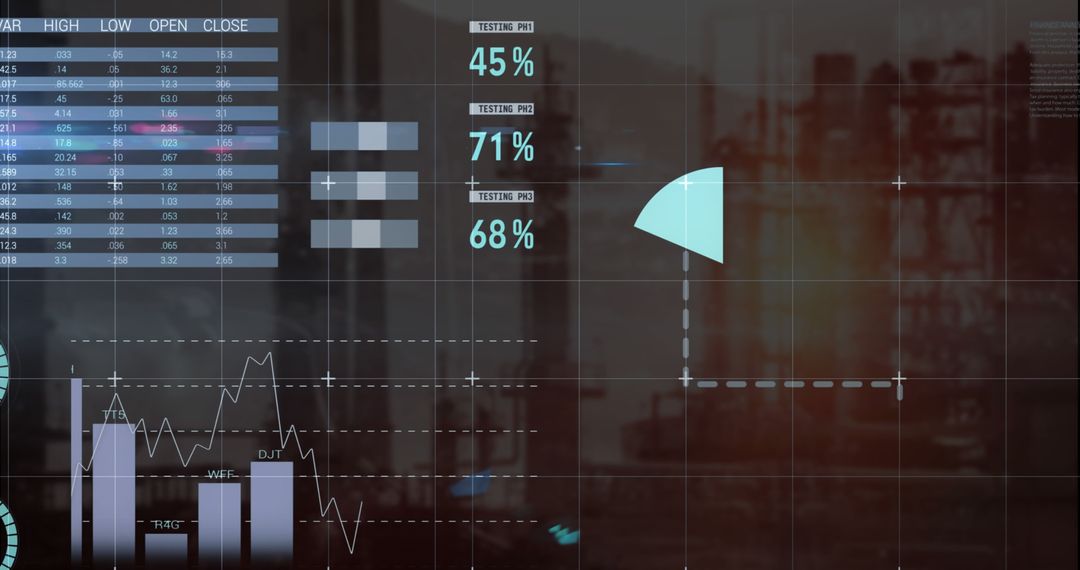
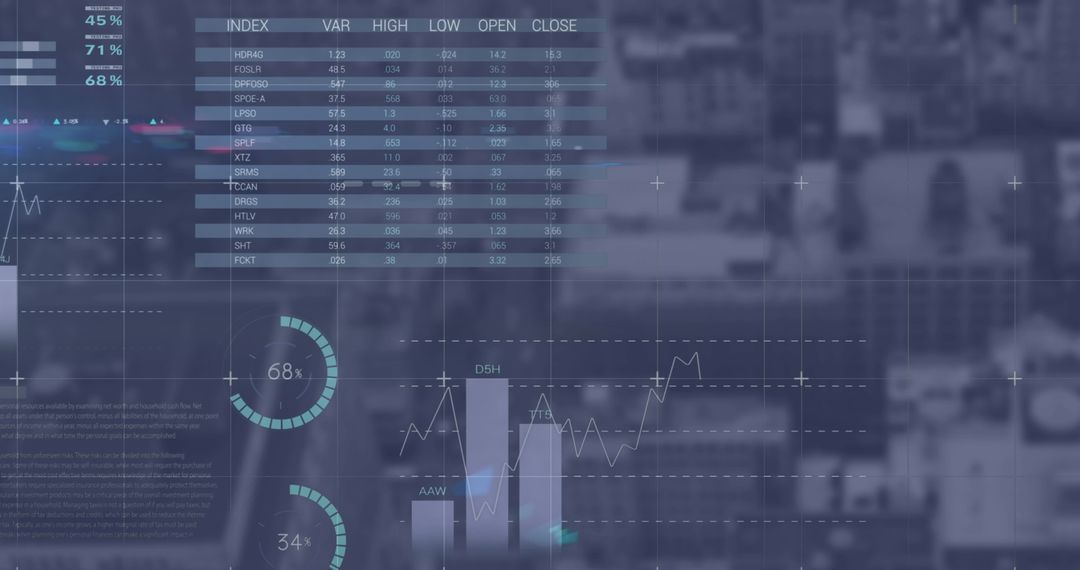
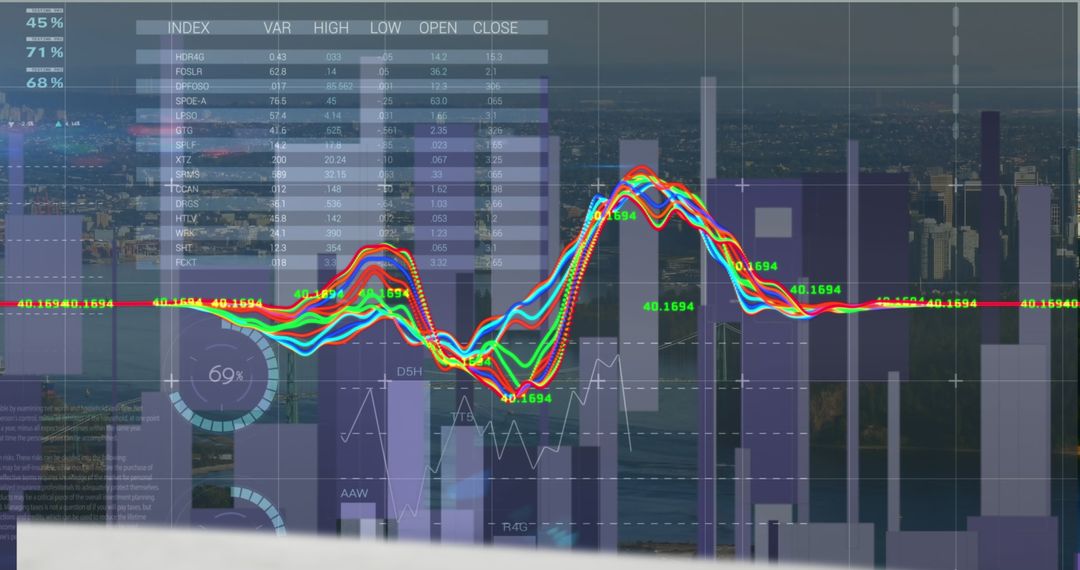
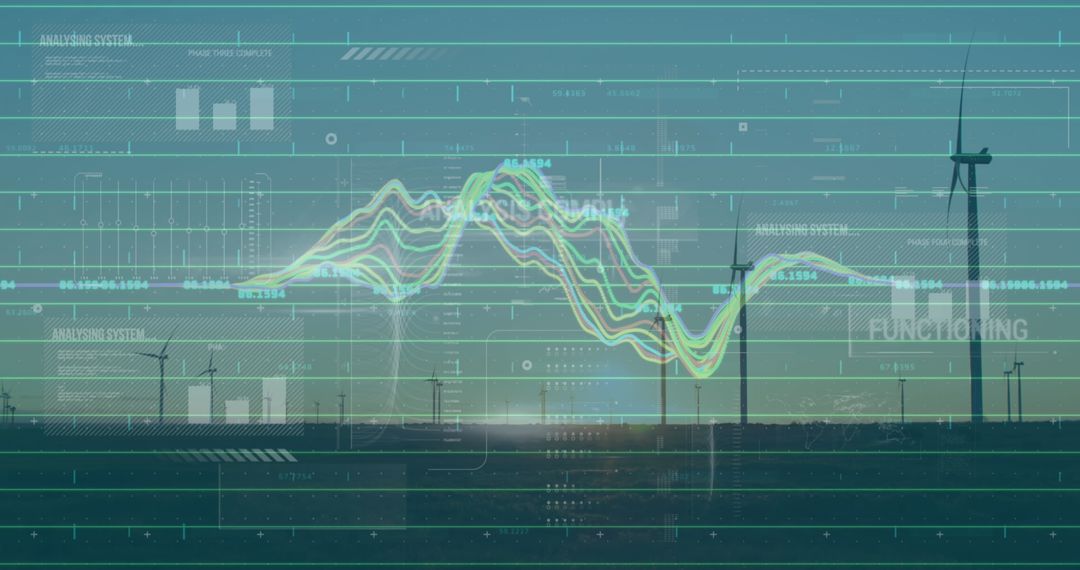
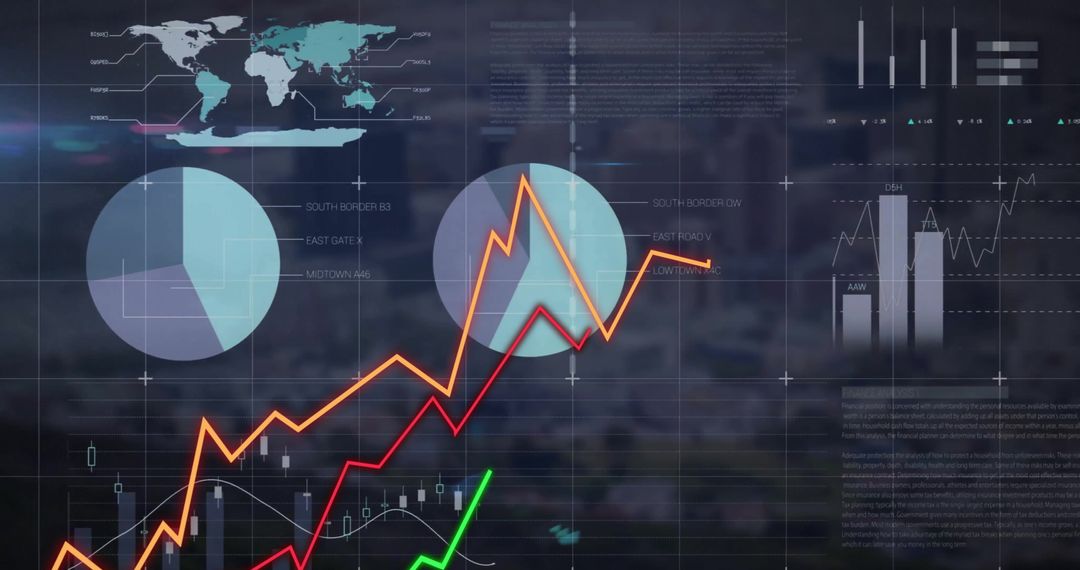
- Futuristic Digital Analytics Dashboard with Growth Arrows
Futuristic Digital Analytics Dashboard with Growth Arrows Image

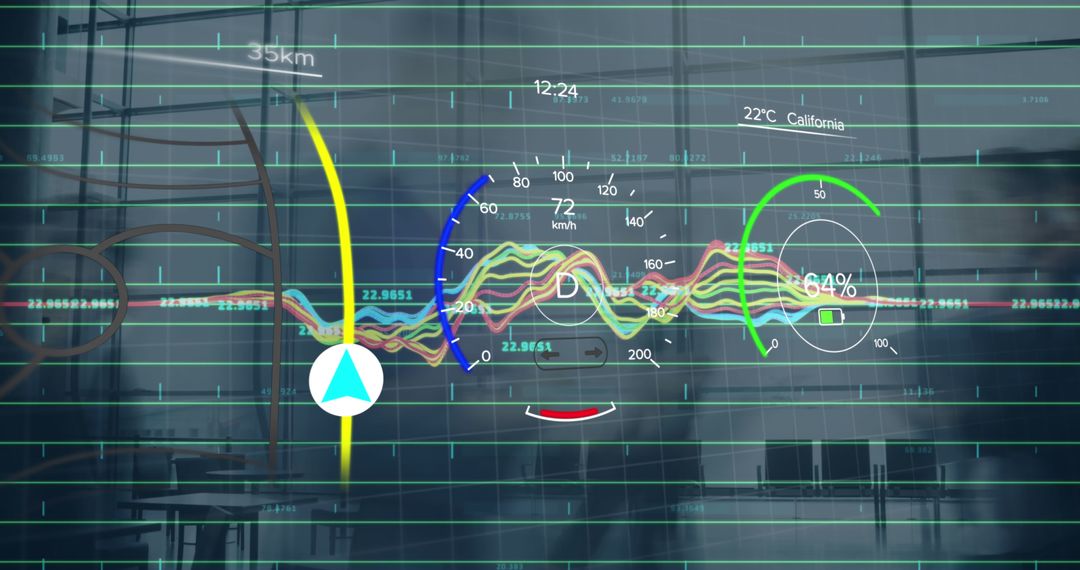
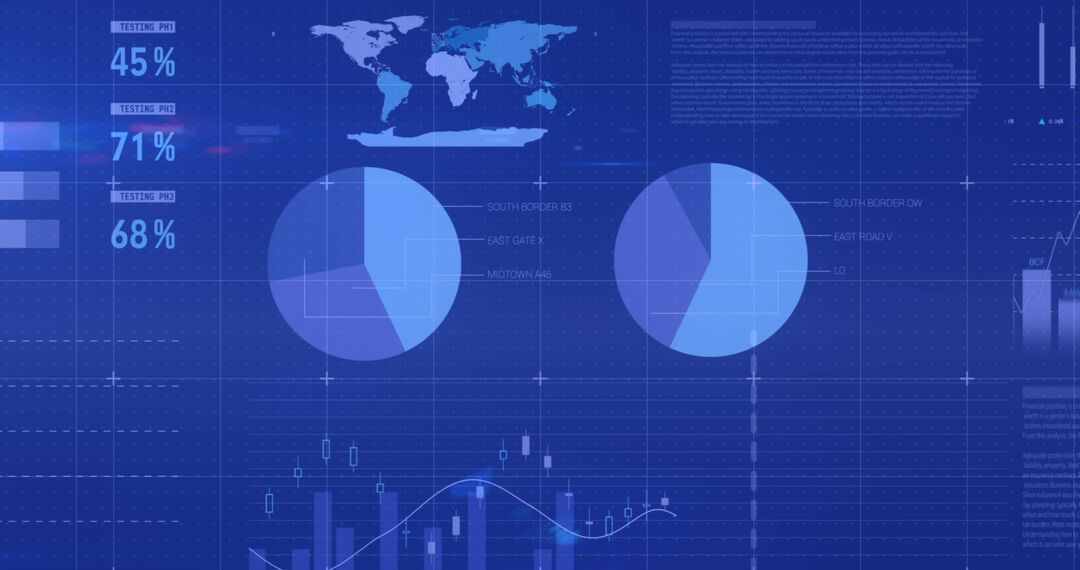
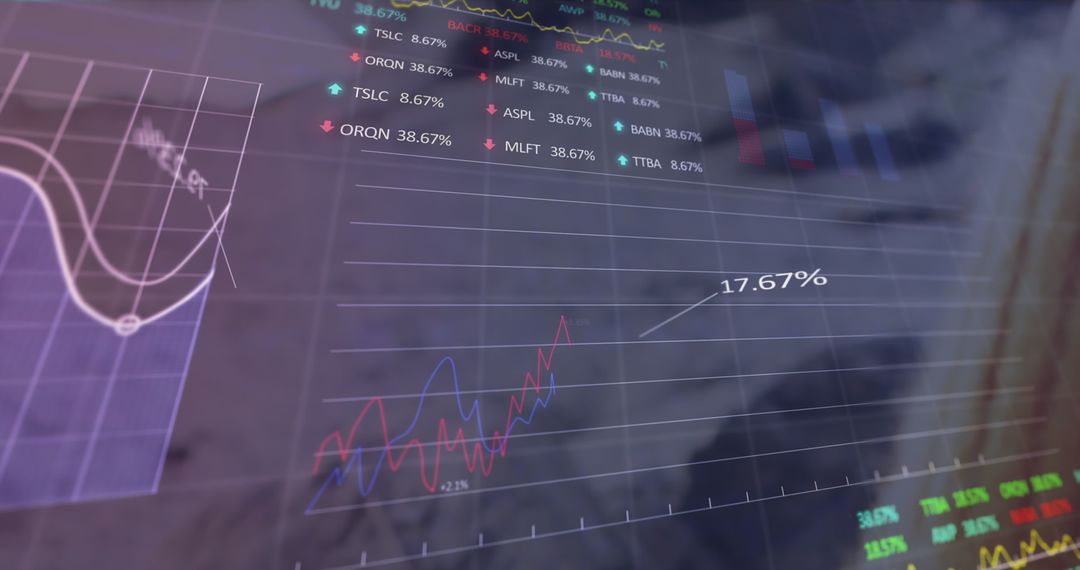
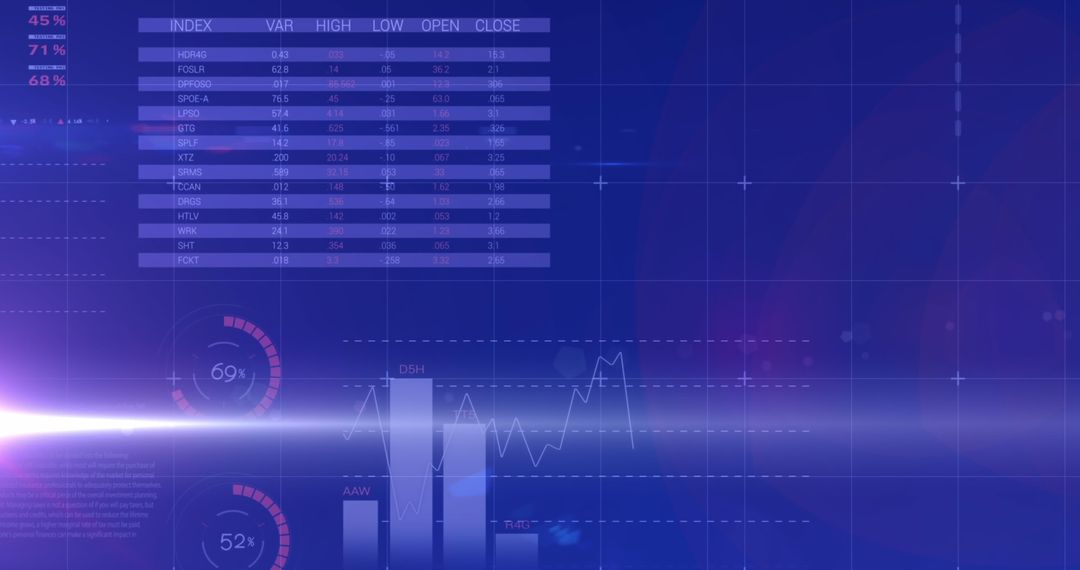
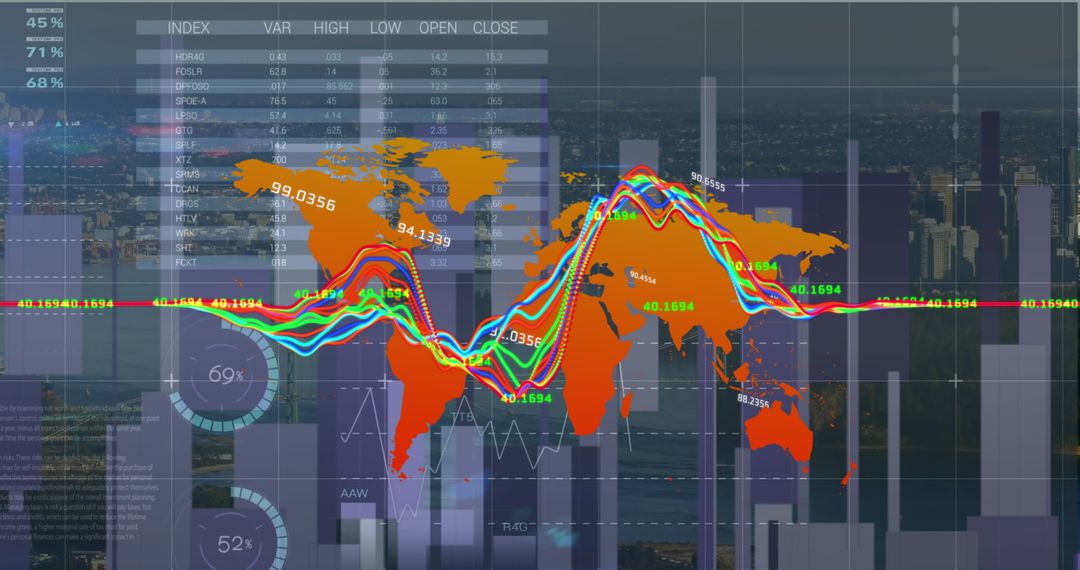
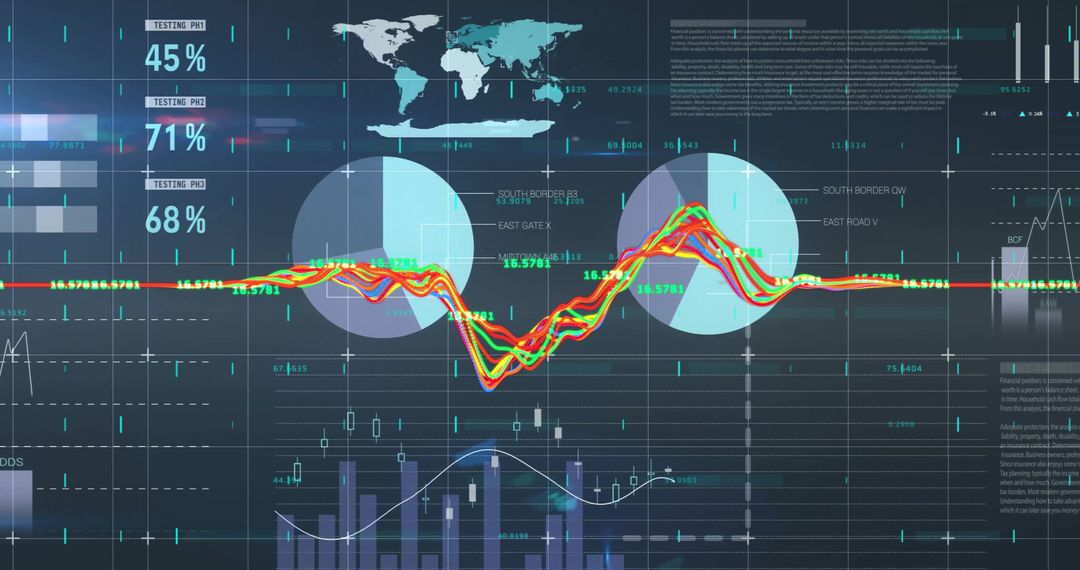
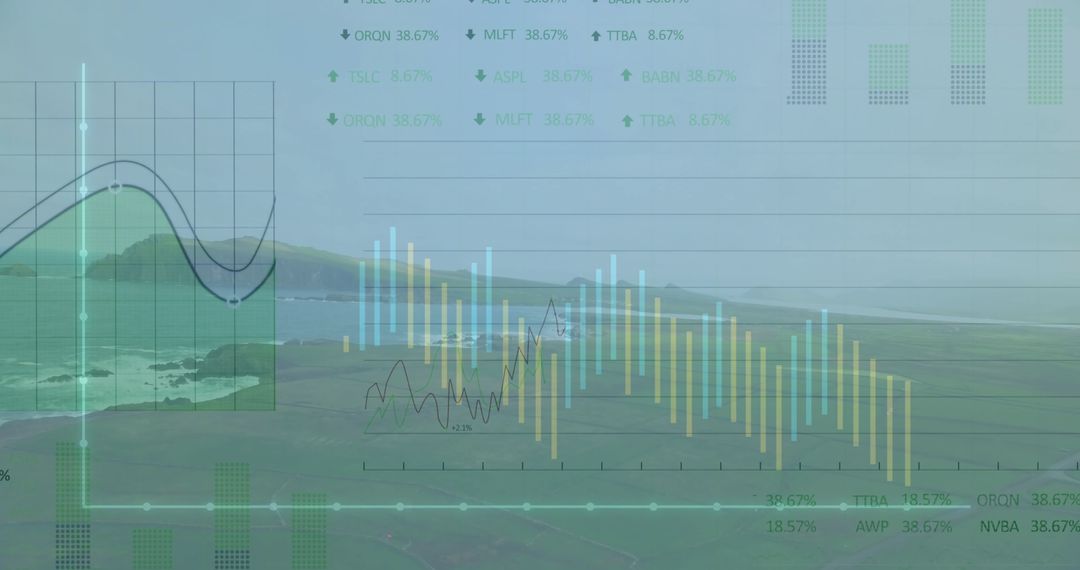
A complex digital dashboard interface displays various financial charts, including bar and line graphs, along with pie charts, within a global context depicted through a world map. Green arrows indicate upward trends, symbolizing growth and positive analytics trends. Ideal for illustrating themes related to business success, data analysis in technology settings, financial market intelligence, and innovative digital interfaces in corporate or educational media.
Powered by  - Get 15% off with code: PIKWIZARD15


0
downloads
downloads
Tags:
More
Credit Photo
If you would like to credit the Photo, here are some ways you can do so
Text Link
photo Link
<span class="text-link">
<span>
<a target="_blank" href=https://pikwizard.com/photo/futuristic-digital-analytics-dashboard-with-growth-arrows/04dc515b24b5b6d88bcf7055d8127cb7/>PikWizard</a>
</span>
</span>
<span class="image-link">
<span
style="margin: 0 0 20px 0; display: inline-block; vertical-align: middle; width: 100%;"
>
<a
target="_blank"
href="https://pikwizard.com/photo/futuristic-digital-analytics-dashboard-with-growth-arrows/04dc515b24b5b6d88bcf7055d8127cb7/"
style="text-decoration: none; font-size: 10px; margin: 0;"
>
<img src="https://pikwizard.com/pw/medium/04dc515b24b5b6d88bcf7055d8127cb7.jpg" style="margin: 0; width: 100%;" alt="" />
<p style="font-size: 12px; margin: 0;">PikWizard</p>
</a>
</span>
</span>
Free (free of charge)
Free for personal and commercial use.
Author: Awesome Content
Similar Free Stock Images

Premium


Premium


Premium


Premium


Premium


Premium


Premium


Premium


Premium


Premium


Premium


Premium


Premium


Premium


Premium


Premium


Premium


Premium


Premium


Premium


Premium


Premium


Premium


Premium

