- Home >
- Stock Photos >
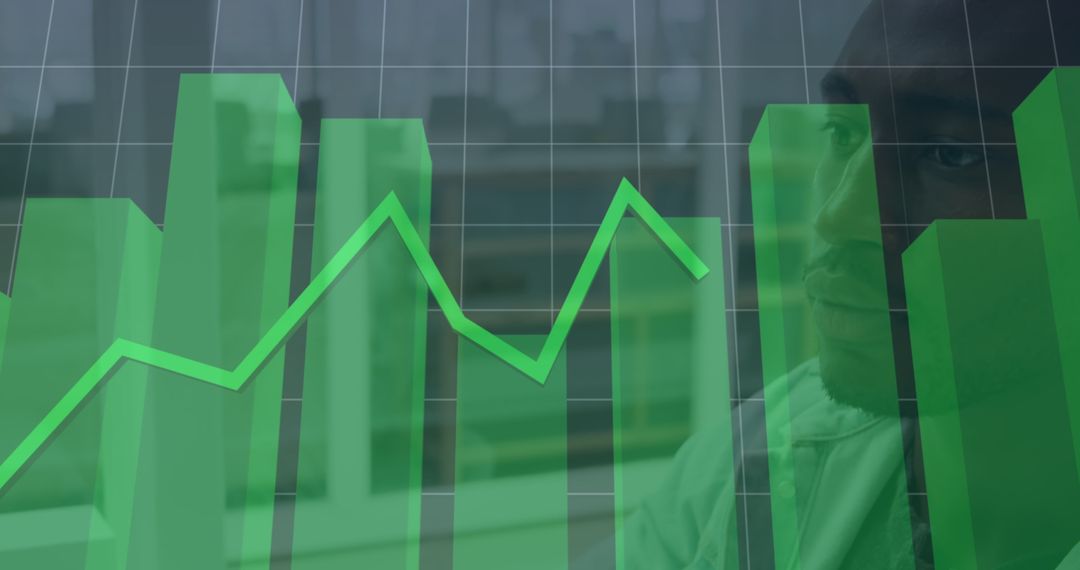
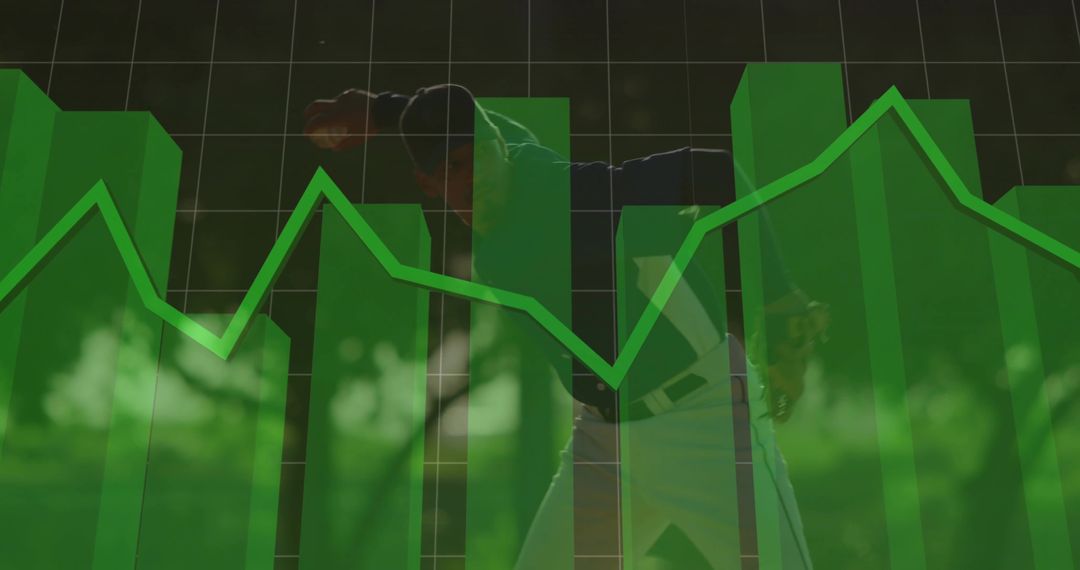
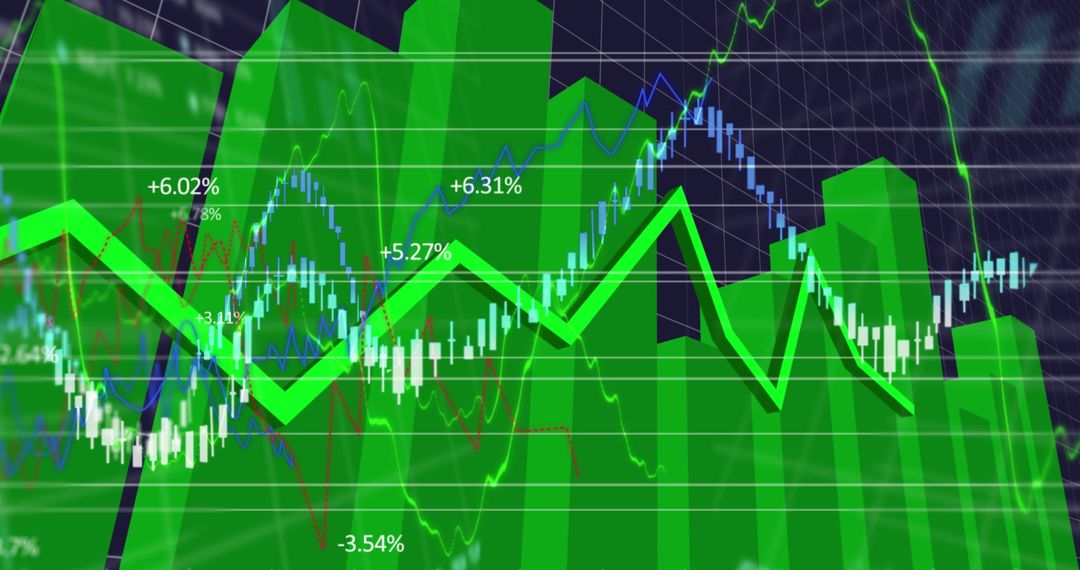
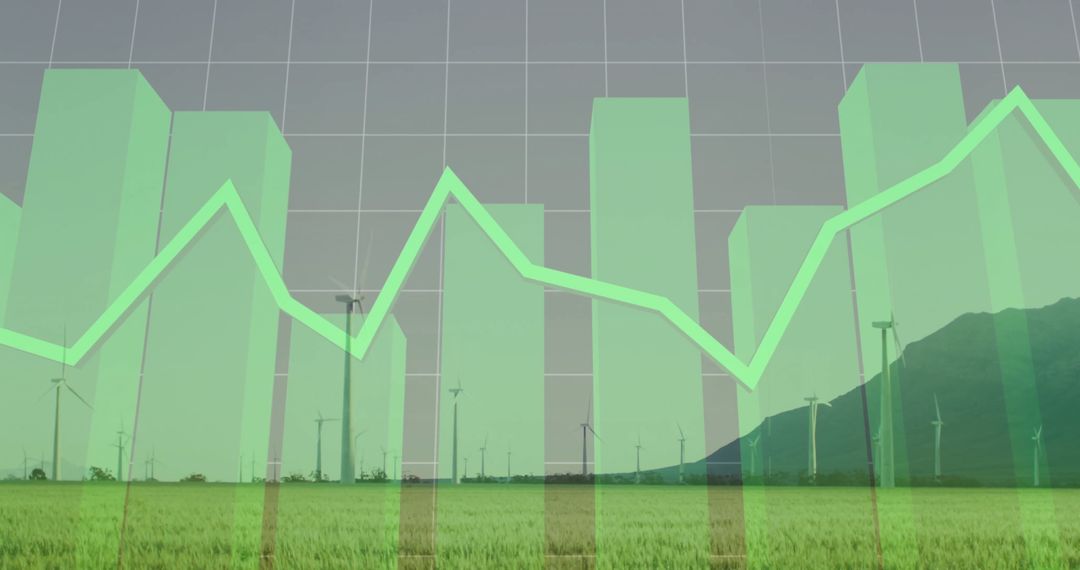
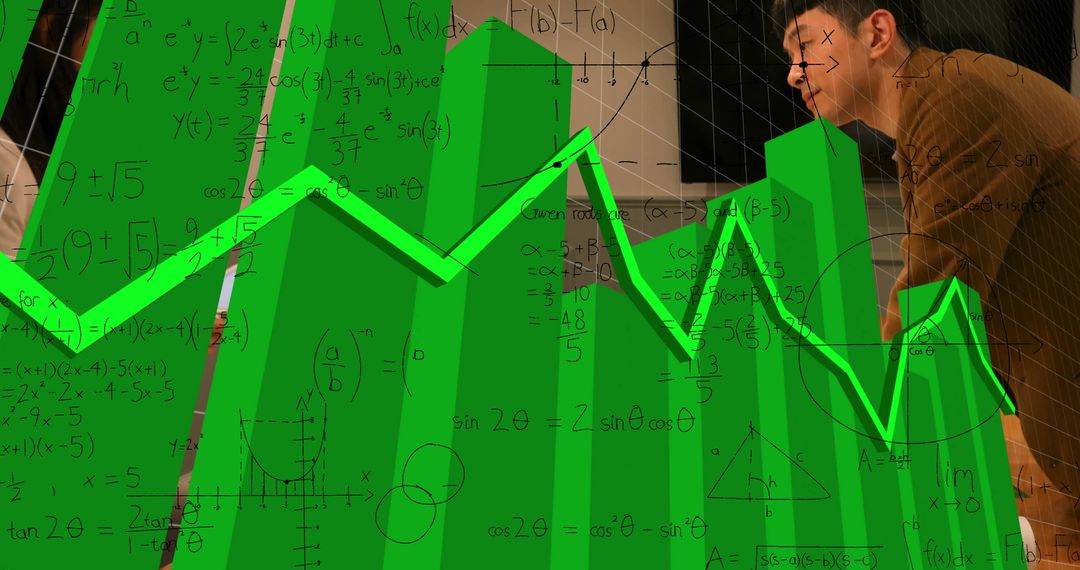
- Futuristic Digital Analytics with Neon Graph Interfaces
Futuristic Digital Analytics with Neon Graph Interfaces Image
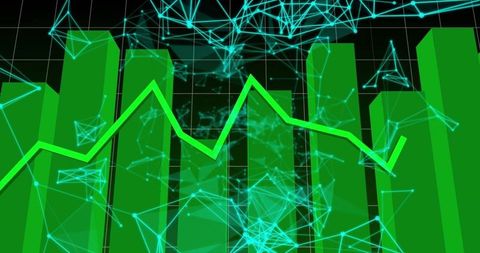
Visual showcases intersection of data analytics and futuristic technology, making it ideal for content related to finance, statistical analysis, data presentations, and technology innovations. Use in marketing materials that emphasize digital transformation or analytic services to capture cutting-edge, tech-savvy vibe.
Powered by 


0
downloads
downloads
Tags:
More
Credit Photo
If you would like to credit the Photo, here are some ways you can do so
Text Link
photo Link
<span class="text-link">
<span>
<a target="_blank" href=https://pikwizard.com/photo/futuristic-digital-analytics-with-neon-graph-interfaces/c89f1d263568750dcc92f8dac195543f/>PikWizard</a>
</span>
</span>
<span class="image-link">
<span
style="margin: 0 0 20px 0; display: inline-block; vertical-align: middle; width: 100%;"
>
<a
target="_blank"
href="https://pikwizard.com/photo/futuristic-digital-analytics-with-neon-graph-interfaces/c89f1d263568750dcc92f8dac195543f/"
style="text-decoration: none; font-size: 10px; margin: 0;"
>
<img src="https://pikwizard.com/pw/medium/c89f1d263568750dcc92f8dac195543f.jpg" style="margin: 0; width: 100%;" alt="" />
<p style="font-size: 12px; margin: 0;">PikWizard</p>
</a>
</span>
</span>
Free (free of charge)
Free for personal and commercial use.
Author: Creative Art
Similar Free Stock Images

Premium


Premium


Premium


Premium


Premium


Premium


Premium


Premium


Premium


Premium


Premium


Premium


Premium


Premium


Premium


Premium


Premium


Premium


Premium


Premium


Premium


Premium


Premium


Premium