- Home >
- Stock Photos >
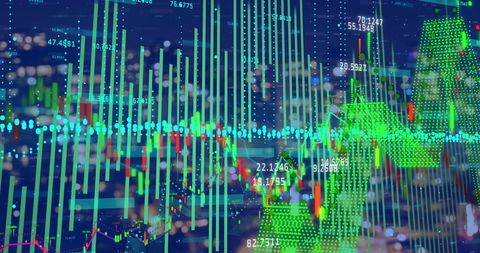
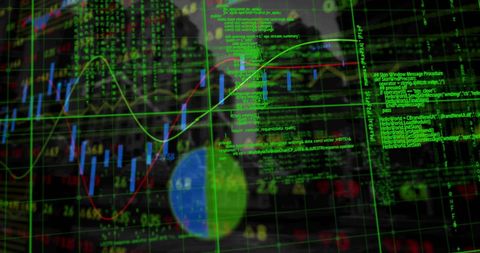
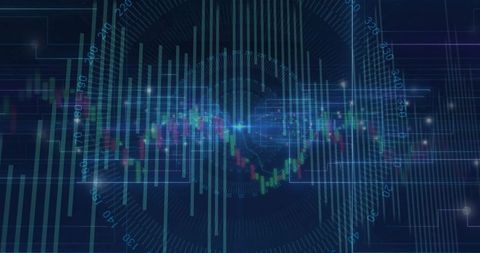
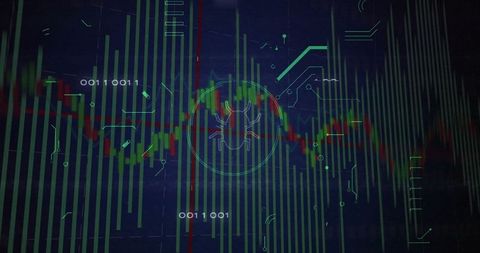
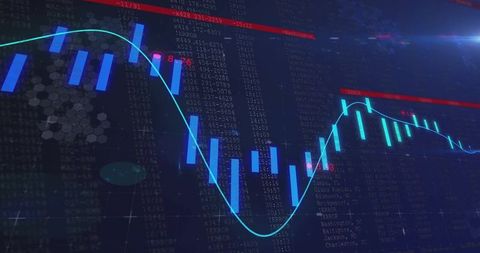
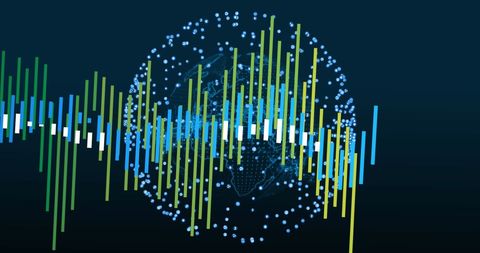
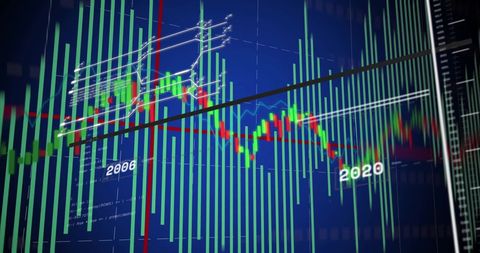
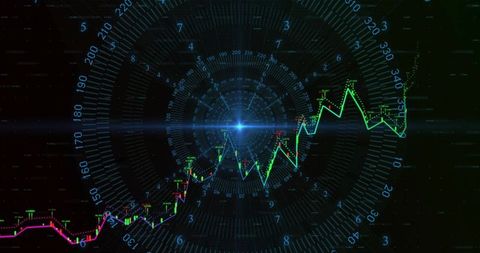
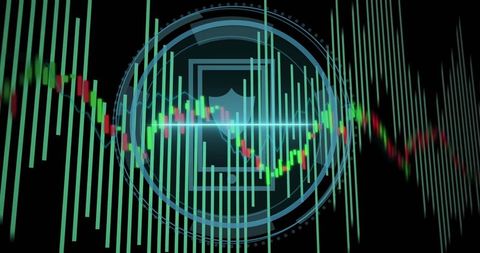
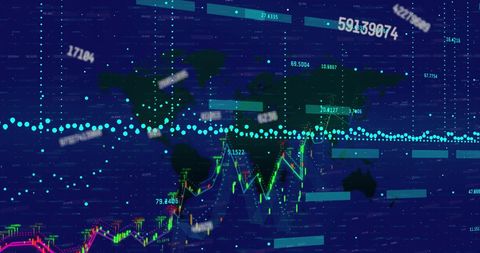
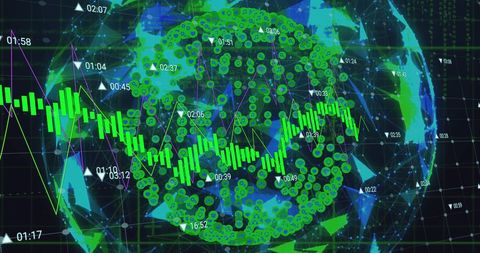
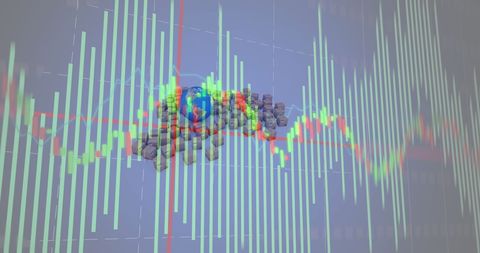
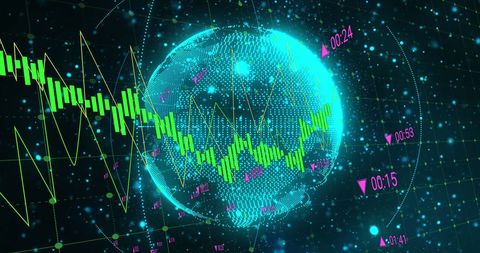
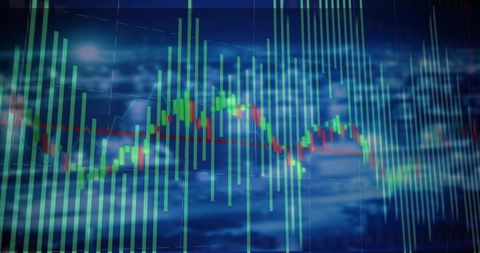
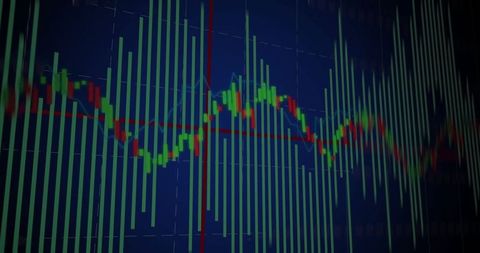
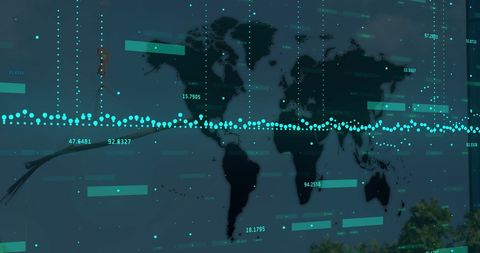
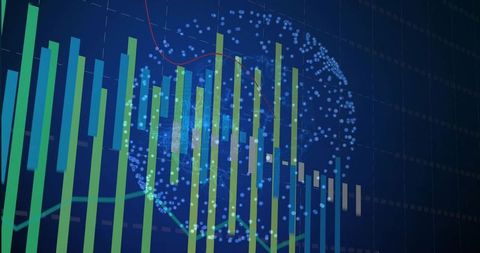
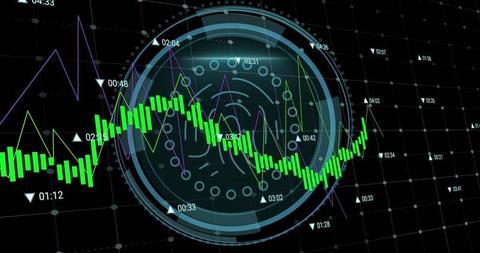
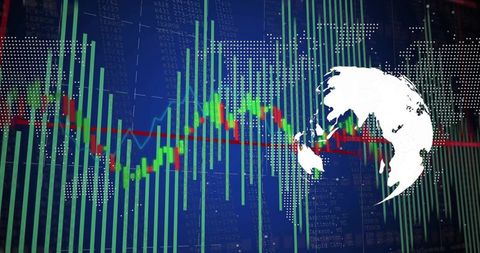
- Futuristic Digital Analytics with Network Sphere and Candlestick Graphs
Futuristic Digital Analytics with Network Sphere and Candlestick Graphs Image
This dynamic visual illustrates advanced data visualization through the combination of a blue network sphere and detailed candlestick and line graph displays. Originally suitable for representing sophisticated financial technology themes, polling graphics, and illustrating analytic backgrounds, this image can be used to enhance finance-related websites, stock market presentations, or data analysis reports by showcasing technological advancement and digital insights.

downloads
Tags:
More
Credit Photo
If you would like to credit the Photo, here are some ways you can do so
Text Link
photo Link
<span class="text-link">
<span>
<a target="_blank" href=https://pikwizard.com/photo/futuristic-digital-analytics-with-network-sphere-and-candlestick-graphs/935add1e2b782c0a1f8827feba7a44c5/>PikWizard</a>
</span>
</span>
<span class="image-link">
<span
style="margin: 0 0 20px 0; display: inline-block; vertical-align: middle; width: 100%;"
>
<a
target="_blank"
href="https://pikwizard.com/photo/futuristic-digital-analytics-with-network-sphere-and-candlestick-graphs/935add1e2b782c0a1f8827feba7a44c5/"
style="text-decoration: none; font-size: 10px; margin: 0;"
>
<img src="https://pikwizard.com/pw/medium/935add1e2b782c0a1f8827feba7a44c5.jpg" style="margin: 0; width: 100%;" alt="" />
<p style="font-size: 12px; margin: 0;">PikWizard</p>
</a>
</span>
</span>
Free (free of charge)
Free for personal and commercial use.
Author: Authentic Images