
- Home >
- Stock Photos >
- Futuristic Digital Analytics with Trend Graph Over City Skyline
Futuristic Digital Analytics with Trend Graph Over City Skyline Image
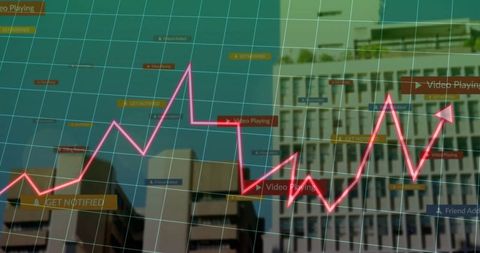
Dynamic presentation of a modern trend line overlaid on city buildings represents growth and change across digital domains. Ideal use in presentations about urban development, financial growth, technology advancements, and analytical tools. Capture attention for businesses in need of conveying abstract data against palpable innovation locales.
Powered by  - Get 15% off with code: PIKWIZARD15


0
downloads
downloads
Tags:
More
Credit Photo
If you would like to credit the Photo, here are some ways you can do so
Text Link
photo Link
<span class="text-link">
<span>
<a target="_blank" href=https://pikwizard.com/photo/futuristic-digital-analytics-with-trend-graph-over-city-skyline/2f424a7920312f772d8f126fa055b0c6/>PikWizard</a>
</span>
</span>
<span class="image-link">
<span
style="margin: 0 0 20px 0; display: inline-block; vertical-align: middle; width: 100%;"
>
<a
target="_blank"
href="https://pikwizard.com/photo/futuristic-digital-analytics-with-trend-graph-over-city-skyline/2f424a7920312f772d8f126fa055b0c6/"
style="text-decoration: none; font-size: 10px; margin: 0;"
>
<img src="https://pikwizard.com/pw/medium/2f424a7920312f772d8f126fa055b0c6.jpg" style="margin: 0; width: 100%;" alt="" />
<p style="font-size: 12px; margin: 0;">PikWizard</p>
</a>
</span>
</span>
Free (free of charge)
Free for personal and commercial use.
Author: Awesome Content