
- Home >
- Stock Photos >
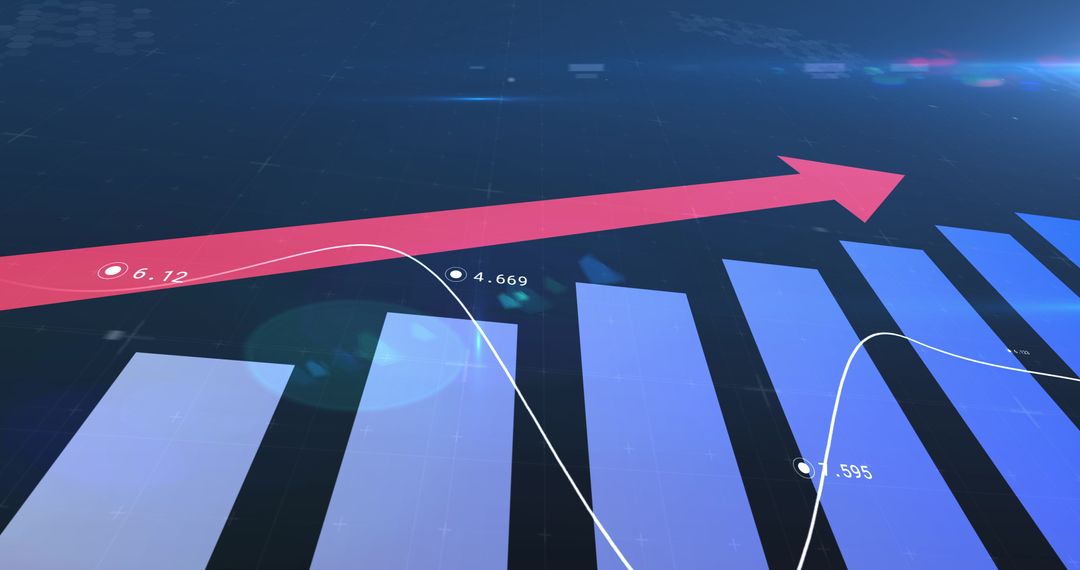
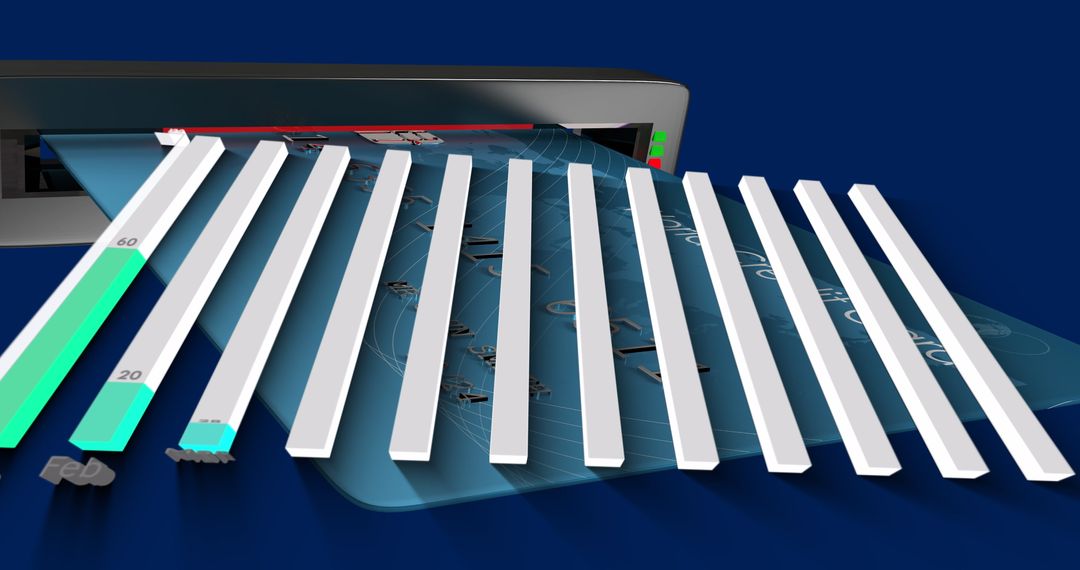
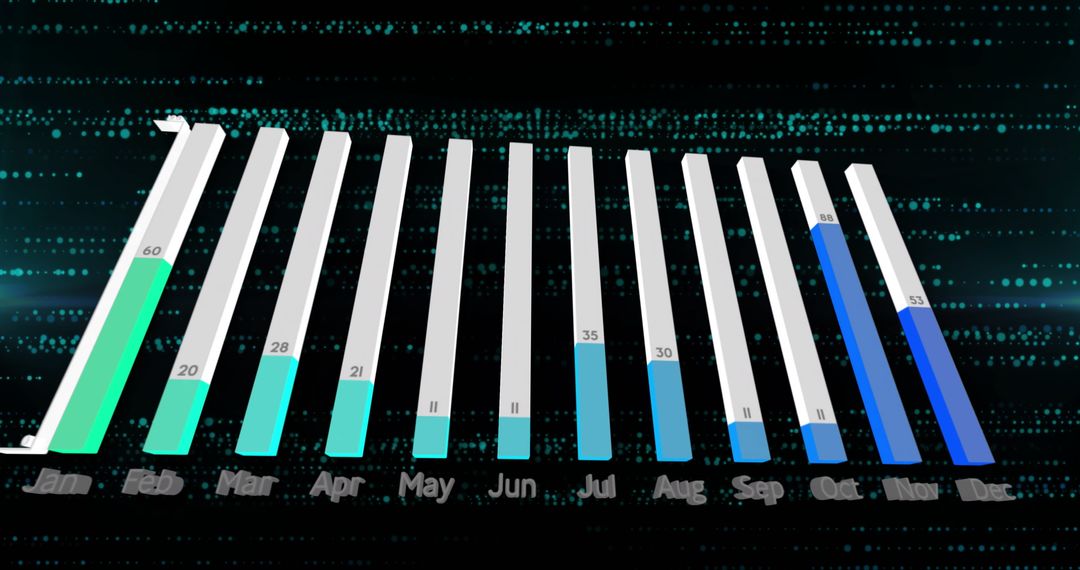
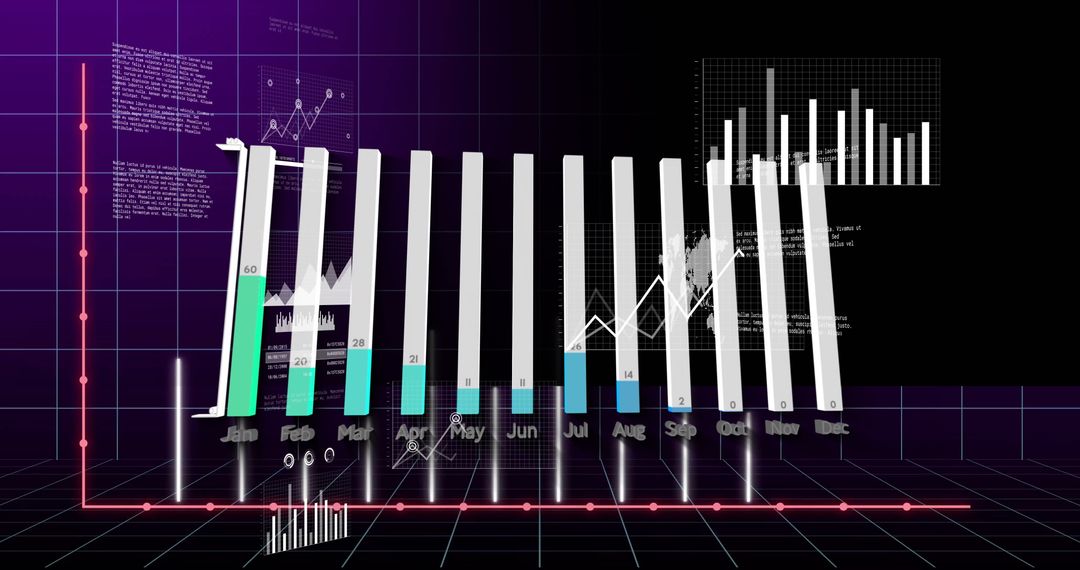
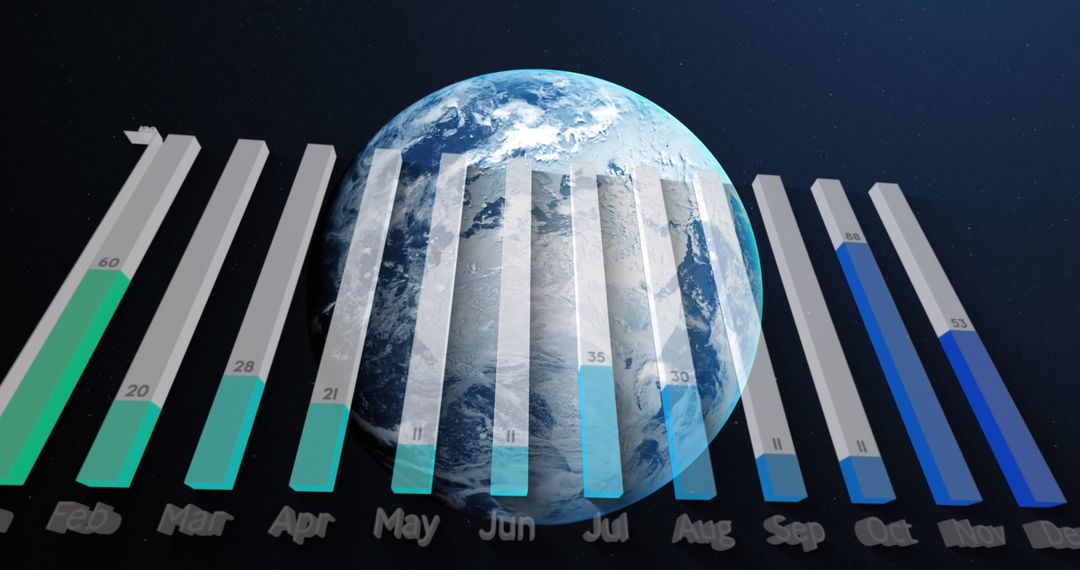
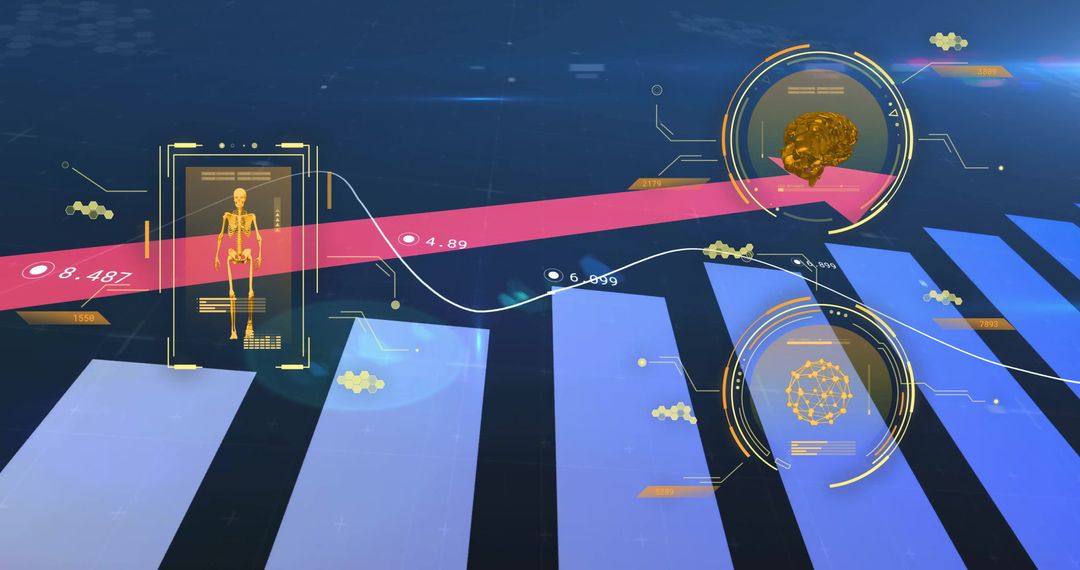
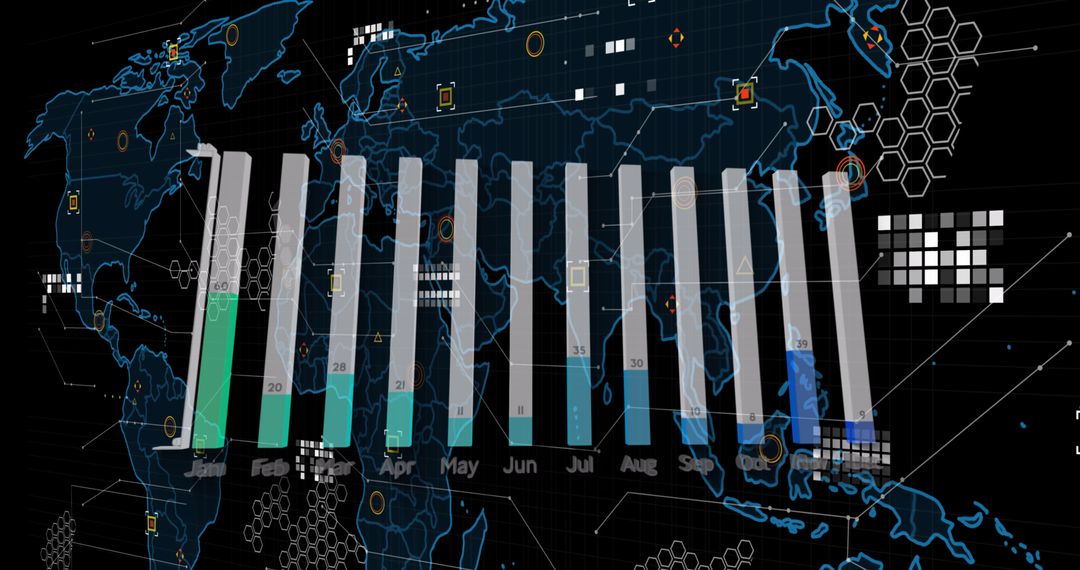
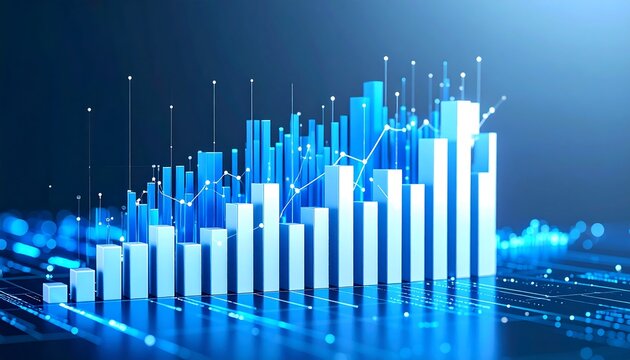
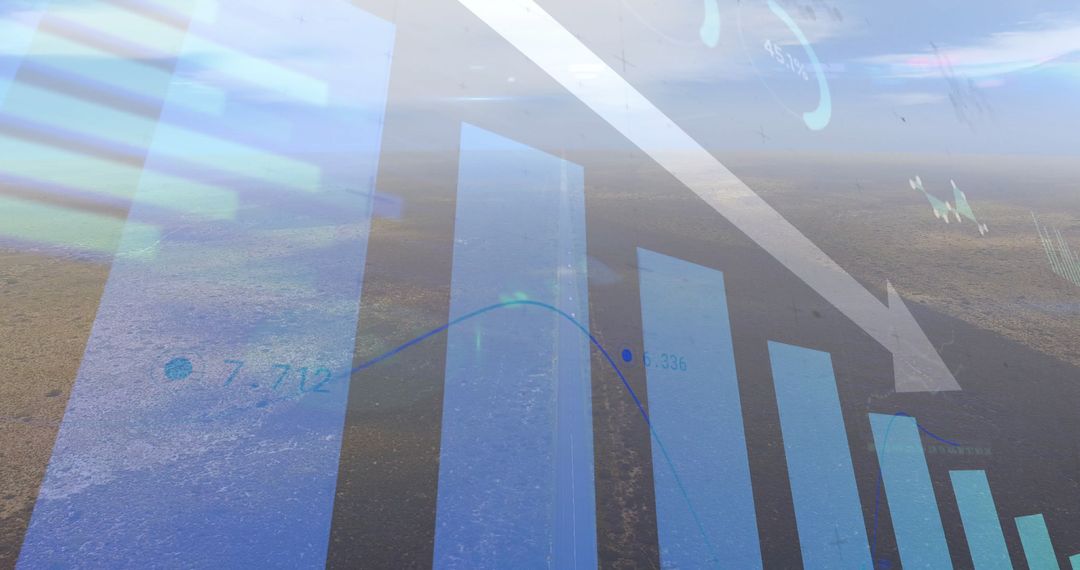
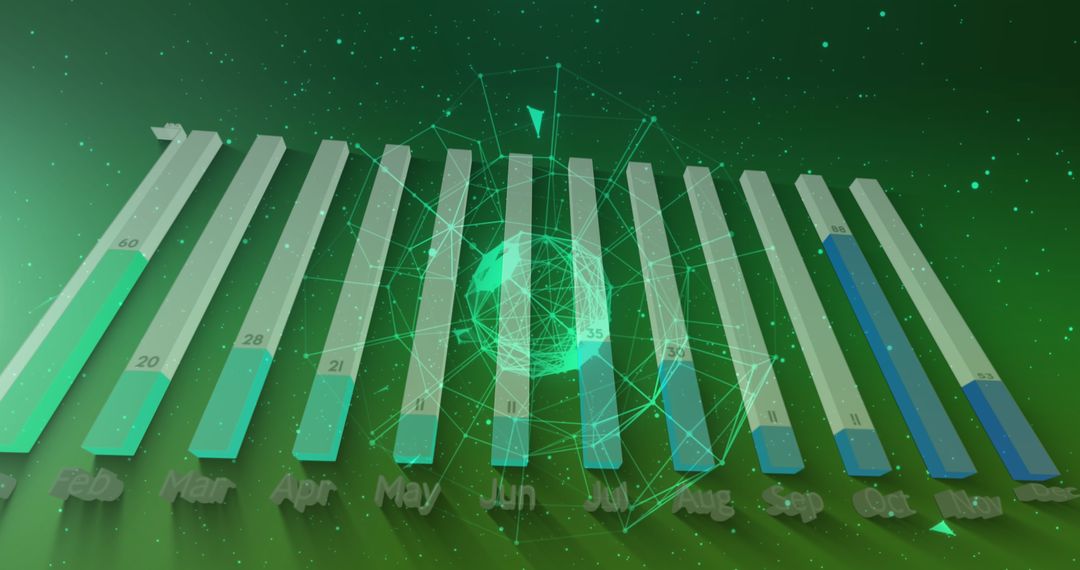
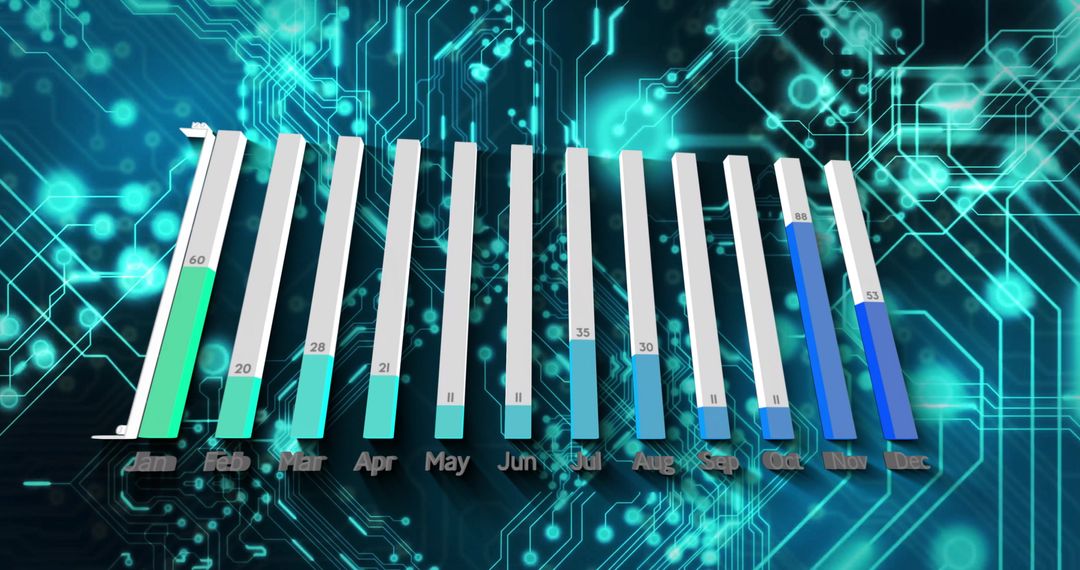
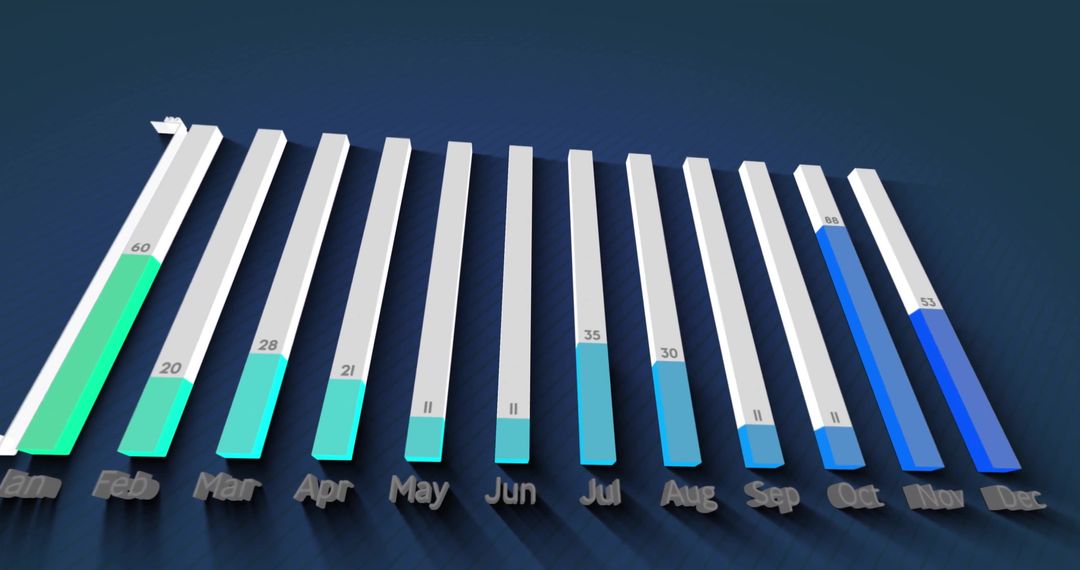
- Futuristic Digital Bar Graph Over Earth Illustrating Global Data Trends
Futuristic Digital Bar Graph Over Earth Illustrating Global Data Trends Image

Illustrative setting showcases interface blending digital innovation with Earth view. Perfect for articles or presentations on technology advancements, global digital analytics, or data interpretation. Ideal for enhancing tech blogs or publications focused on digital strategies and transformations.
Powered by 


6
downloads
downloads
Tags:
More
Credit Photo
If you would like to credit the Photo, here are some ways you can do so
Text Link
photo Link
<span class="text-link">
<span>
<a target="_blank" href=https://pikwizard.com/photo/futuristic-digital-bar-graph-over-earth-illustrating-global-data-trends/038c25a691899c713cc810e9c015e007/>PikWizard</a>
</span>
</span>
<span class="image-link">
<span
style="margin: 0 0 20px 0; display: inline-block; vertical-align: middle; width: 100%;"
>
<a
target="_blank"
href="https://pikwizard.com/photo/futuristic-digital-bar-graph-over-earth-illustrating-global-data-trends/038c25a691899c713cc810e9c015e007/"
style="text-decoration: none; font-size: 10px; margin: 0;"
>
<img src="https://pikwizard.com/pw/medium/038c25a691899c713cc810e9c015e007.jpg" style="margin: 0; width: 100%;" alt="" />
<p style="font-size: 12px; margin: 0;">PikWizard</p>
</a>
</span>
</span>
Free (free of charge)
Free for personal and commercial use.
Author: Authentic Images
Similar Free Stock Images
Premium


Premium


Premium


Premium


Premium


Premium


Premium


Premium


Premium


Premium


Premium


Premium


Premium


Premium


Premium

Premium


Premium


Premium


Premium


Premium


Premium


Premium


Premium


Premium

