
- Home >
- Stock Photos >
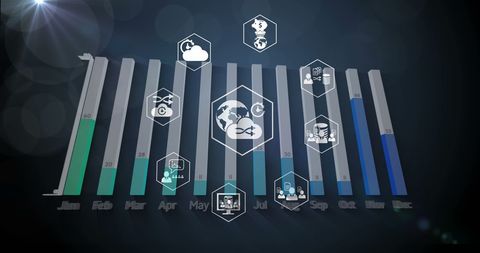
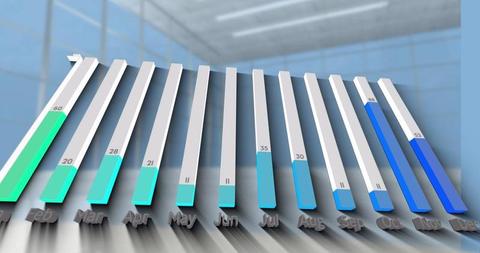
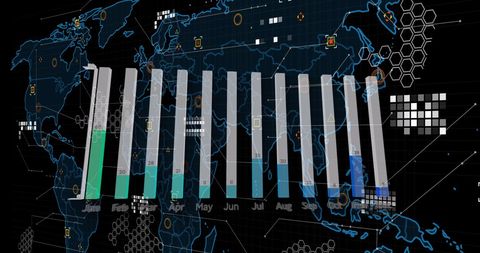
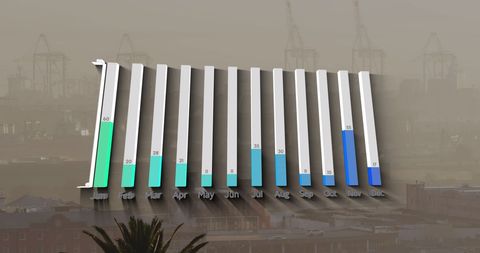
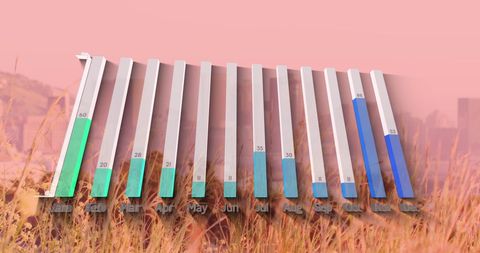
- Futuristic Digital Bar Graph with Monthly Data on Technology Interface
Futuristic Digital Bar Graph with Monthly Data on Technology Interface Image
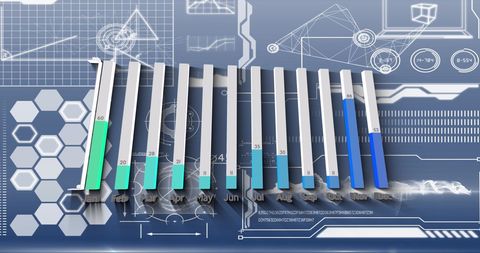
Modern visualization of monthly statistics showcasing futuristic digital elements on sleek interface. Ideal for presentations on data trends, business growth analysis, or technological advancement themes. Use in reports highlighting progress, innovations, or decision-making processes in corporate settings.
Powered by 


downloads
Tags:
More
Credit Photo
If you would like to credit the Photo, here are some ways you can do so
Text Link
photo Link
<span class="text-link">
<span>
<a target="_blank" href=https://pikwizard.com/photo/futuristic-digital-bar-graph-with-monthly-data-on-technology-interface/7d1763c20764645eedae0a6ceb0d82e4/>PikWizard</a>
</span>
</span>
<span class="image-link">
<span
style="margin: 0 0 20px 0; display: inline-block; vertical-align: middle; width: 100%;"
>
<a
target="_blank"
href="https://pikwizard.com/photo/futuristic-digital-bar-graph-with-monthly-data-on-technology-interface/7d1763c20764645eedae0a6ceb0d82e4/"
style="text-decoration: none; font-size: 10px; margin: 0;"
>
<img src="https://pikwizard.com/pw/medium/7d1763c20764645eedae0a6ceb0d82e4.jpg" style="margin: 0; width: 100%;" alt="" />
<p style="font-size: 12px; margin: 0;">PikWizard</p>
</a>
</span>
</span>
Free (free of charge)
Free for personal and commercial use.
Author: People Creations
Similar Free Stock Images
Premium


Premium
Premium


Premium


Premium


Premium


Premium


Premium

Premium


Premium


Premium


Premium


Premium


Premium


Premium


Premium


Premium

Premium


Premium

Premium


Premium

Premium


Premium


Premium


Premium

Explore More Free Stock Images