- Home >
- Stock Photos >
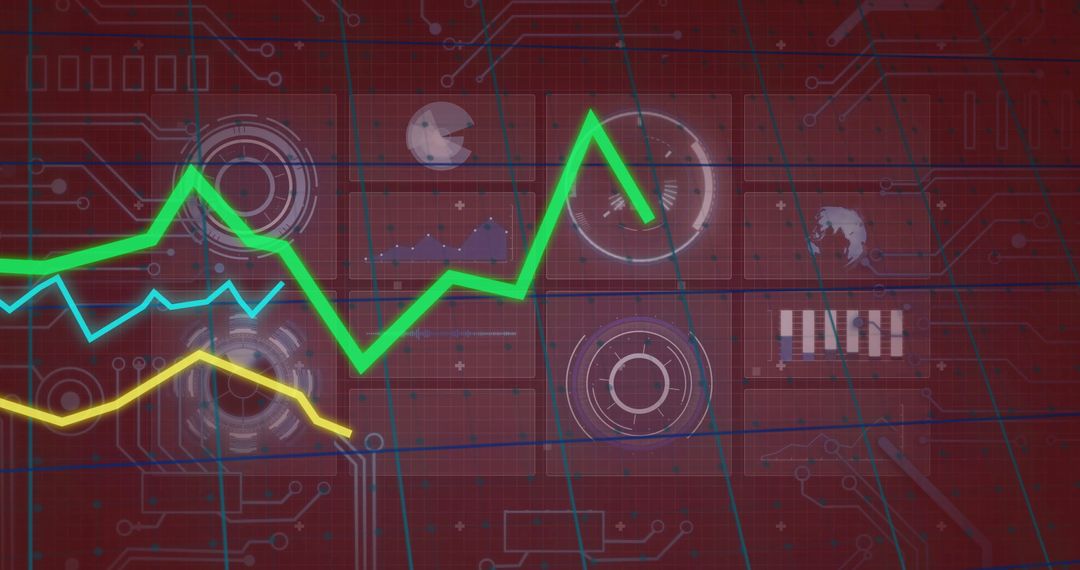
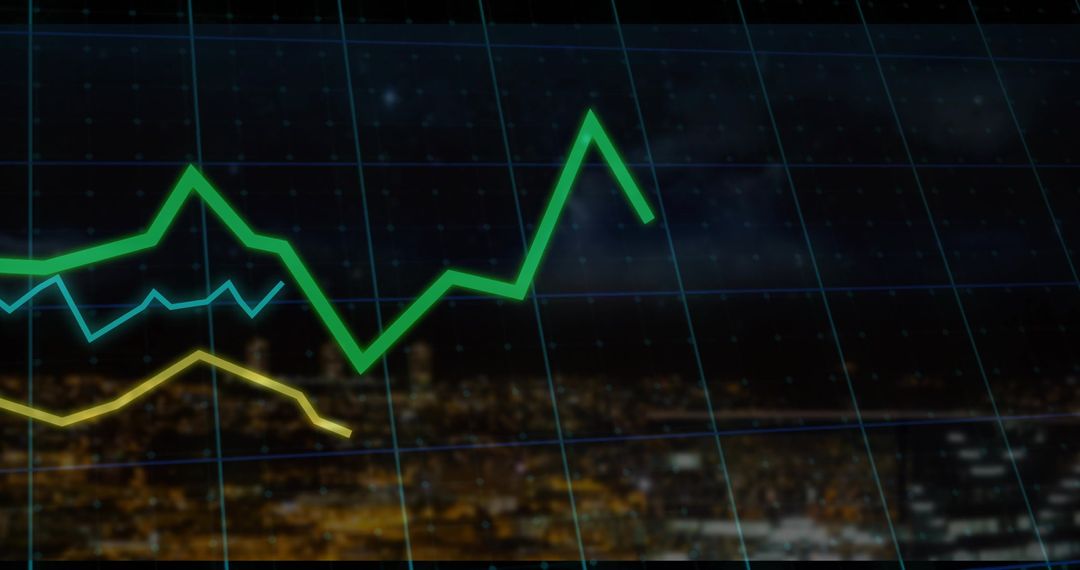
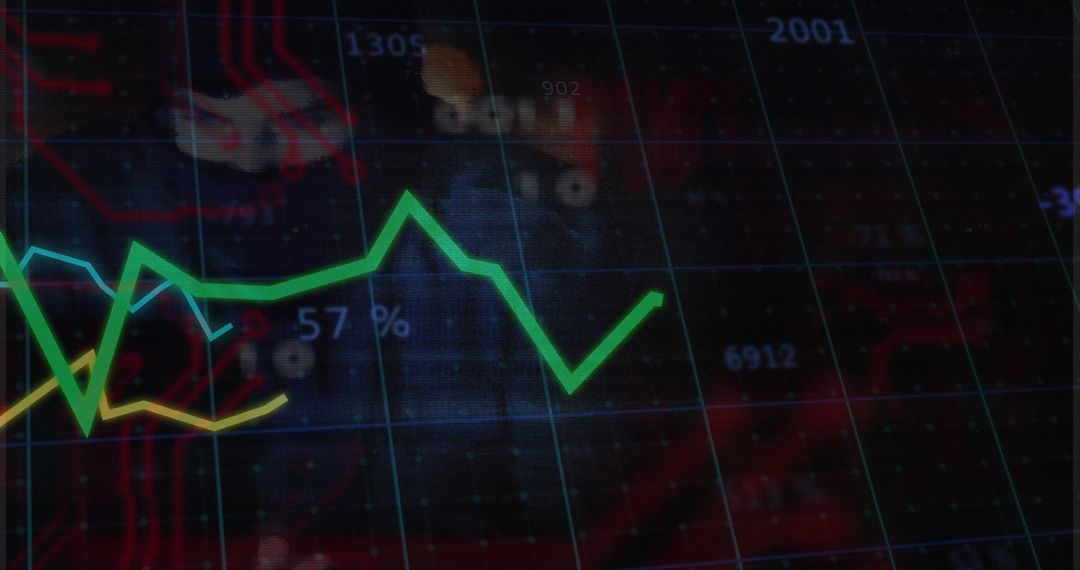
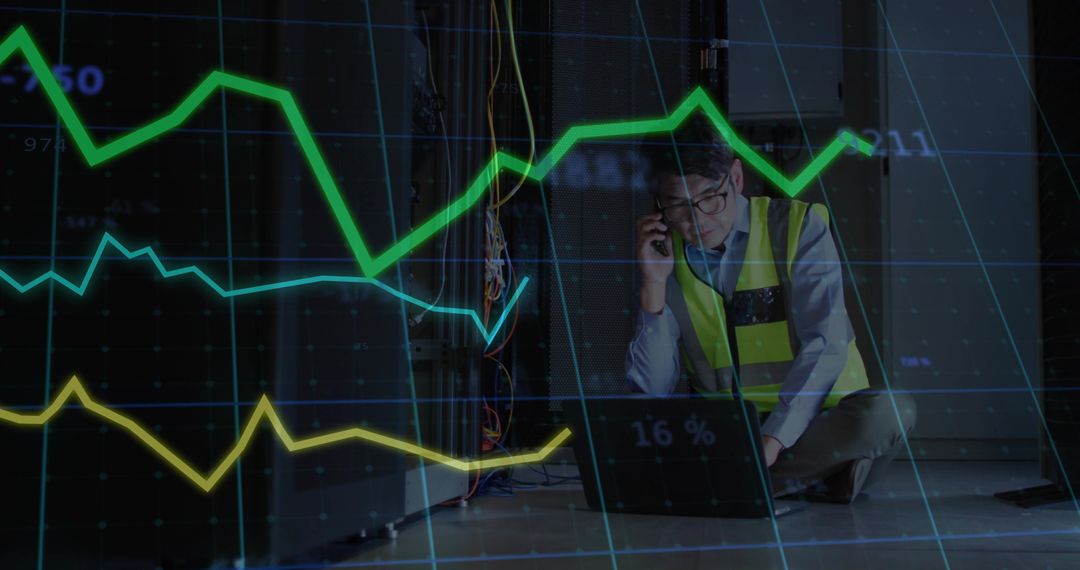
- Futuristic Digital Dashboard Displaying Rising Trend Lines CG Model
Futuristic Digital Dashboard Displaying Rising Trend Lines CG Model Image

Depicting a vibrant, futuristic control room dashboard with rising neon green trend lines against a digital grid. This visualization theme conveys themes of innovation, analytics, and advanced technology. Useful for illustrating data analysis concepts, digital marketing materials, or technology presentation slides emphasizing forward-thinking ideas and technological progress.
Powered by 


0
downloads
downloads
Tags:
More
Credit Photo
If you would like to credit the Photo, here are some ways you can do so
Text Link
photo Link
<span class="text-link">
<span>
<a target="_blank" href=https://pikwizard.com/photo/futuristic-digital-dashboard-displaying-rising-trend-lines-cg-model/da211fc5a057d2fb7f33ba263ed92408/>PikWizard</a>
</span>
</span>
<span class="image-link">
<span
style="margin: 0 0 20px 0; display: inline-block; vertical-align: middle; width: 100%;"
>
<a
target="_blank"
href="https://pikwizard.com/photo/futuristic-digital-dashboard-displaying-rising-trend-lines-cg-model/da211fc5a057d2fb7f33ba263ed92408/"
style="text-decoration: none; font-size: 10px; margin: 0;"
>
<img src="https://pikwizard.com/pw/medium/da211fc5a057d2fb7f33ba263ed92408.jpg" style="margin: 0; width: 100%;" alt="" />
<p style="font-size: 12px; margin: 0;">PikWizard</p>
</a>
</span>
</span>
Free (free of charge)
Free for personal and commercial use.
Author: Authentic Images
Similar Free Stock Images

Premium


Premium


Premium


Premium


Premium


Premium


Premium


Premium


Premium


Premium


Premium


Premium


Premium


Premium


Premium


Premium


Premium


Premium


Premium


Premium


Premium


Premium


Premium


Premium