
- Home >
- Stock Photos >
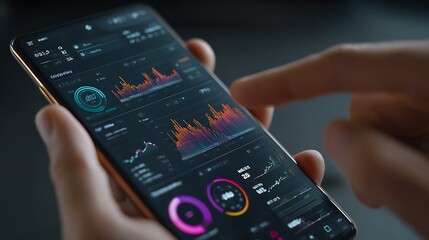
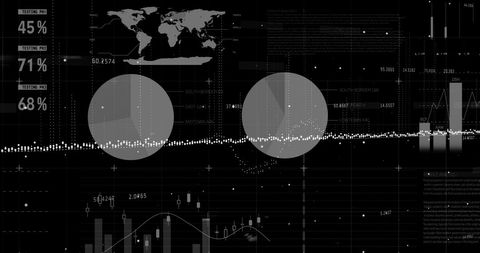
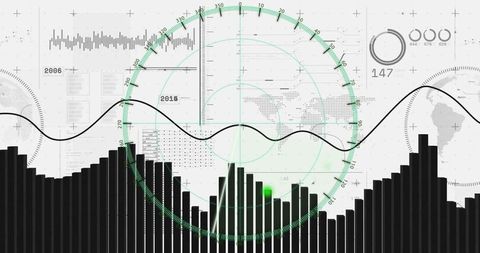
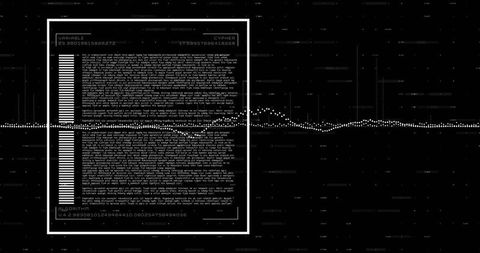
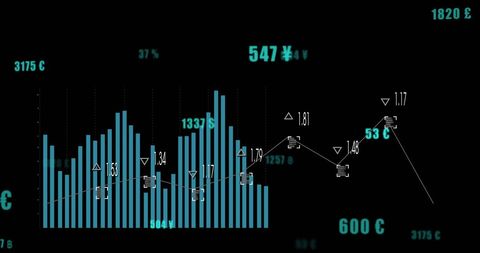
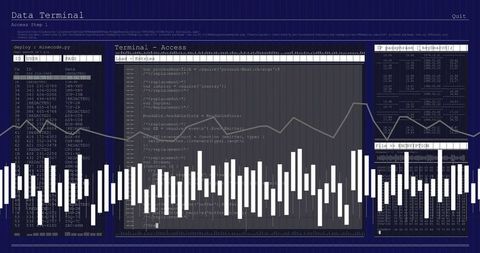
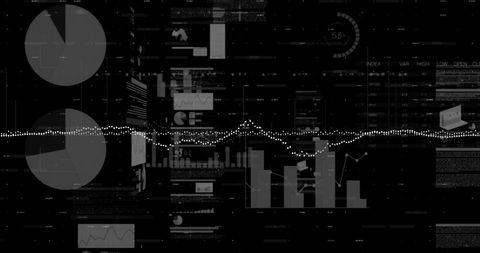
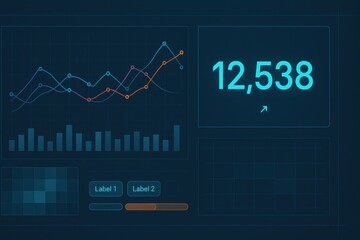
- Futuristic Digital Dashboard Overlay with Data Visualizations
Futuristic Digital Dashboard Overlay with Data Visualizations Image

Digital dashboard features graphs, charts, and a world map for data representation. Ideal for business presentations, analytics software, or illustrating technological advancements in data monitoring and interpretation.
Powered by 


downloads
Tags:
More
Credit Photo
If you would like to credit the Photo, here are some ways you can do so
Text Link
photo Link
<span class="text-link">
<span>
<a target="_blank" href=https://pikwizard.com/photo/futuristic-digital-dashboard-overlay-with-data-visualizations/6437ddefbdb656521b17429ead94a0e4/>PikWizard</a>
</span>
</span>
<span class="image-link">
<span
style="margin: 0 0 20px 0; display: inline-block; vertical-align: middle; width: 100%;"
>
<a
target="_blank"
href="https://pikwizard.com/photo/futuristic-digital-dashboard-overlay-with-data-visualizations/6437ddefbdb656521b17429ead94a0e4/"
style="text-decoration: none; font-size: 10px; margin: 0;"
>
<img src="https://pikwizard.com/pw/medium/6437ddefbdb656521b17429ead94a0e4.jpg" style="margin: 0; width: 100%;" alt="" />
<p style="font-size: 12px; margin: 0;">PikWizard</p>
</a>
</span>
</span>
Free (free of charge)
Free for personal and commercial use.
Author: Awesome Content
Similar Free Stock Images

Premium


Premium

Premium


Premium

Premium


Premium


Premium


Premium


Premium


Premium

Premium


Premium


Premium


Premium


Premium


Premium


Premium


Premium


Premium


Premium


Premium


Premium


Premium
Premium


Premium


Explore More Free Stock Images