- Home >
- Stock Photos >
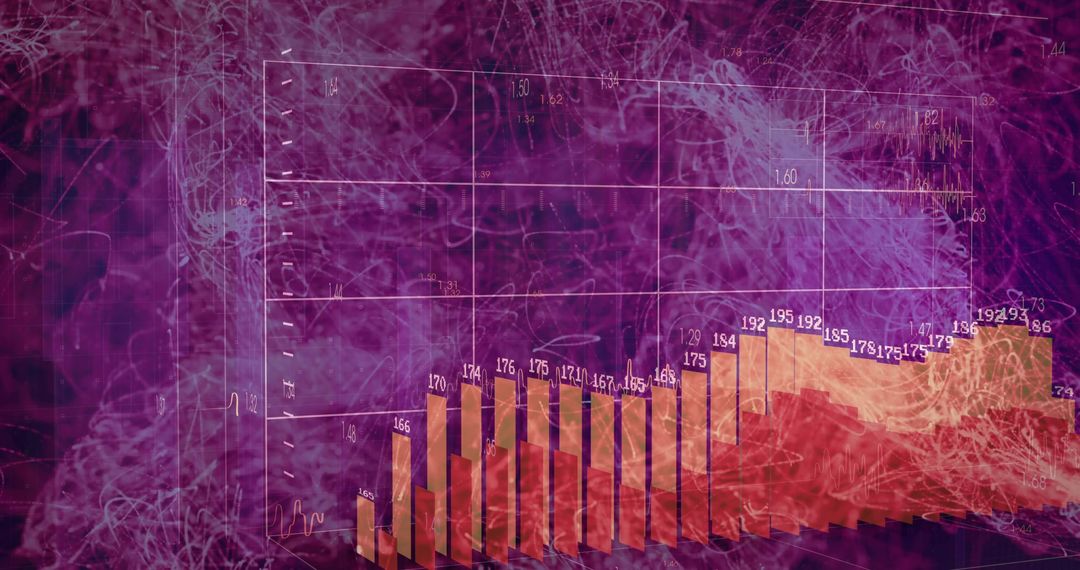
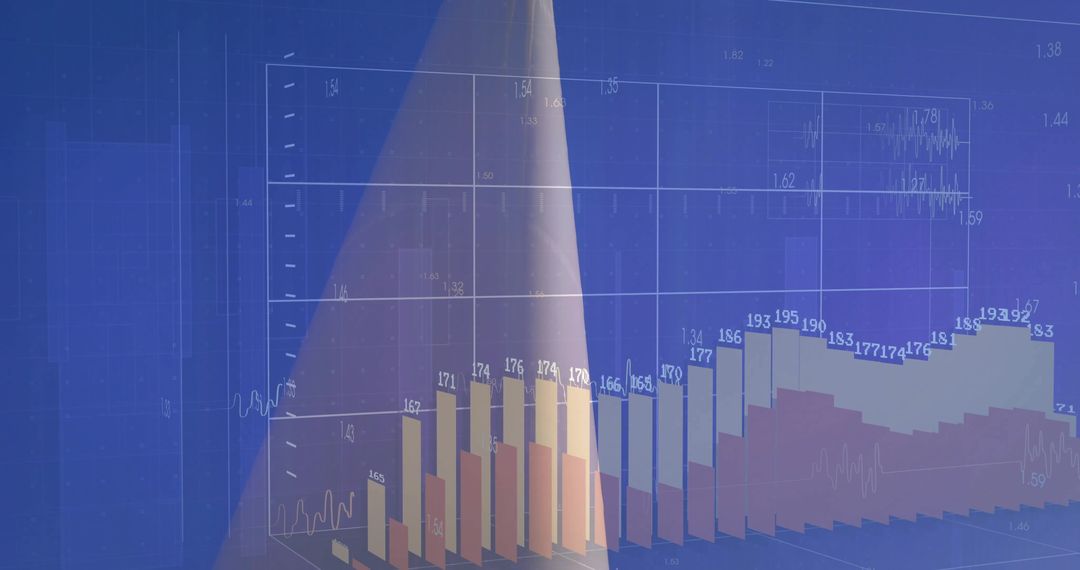
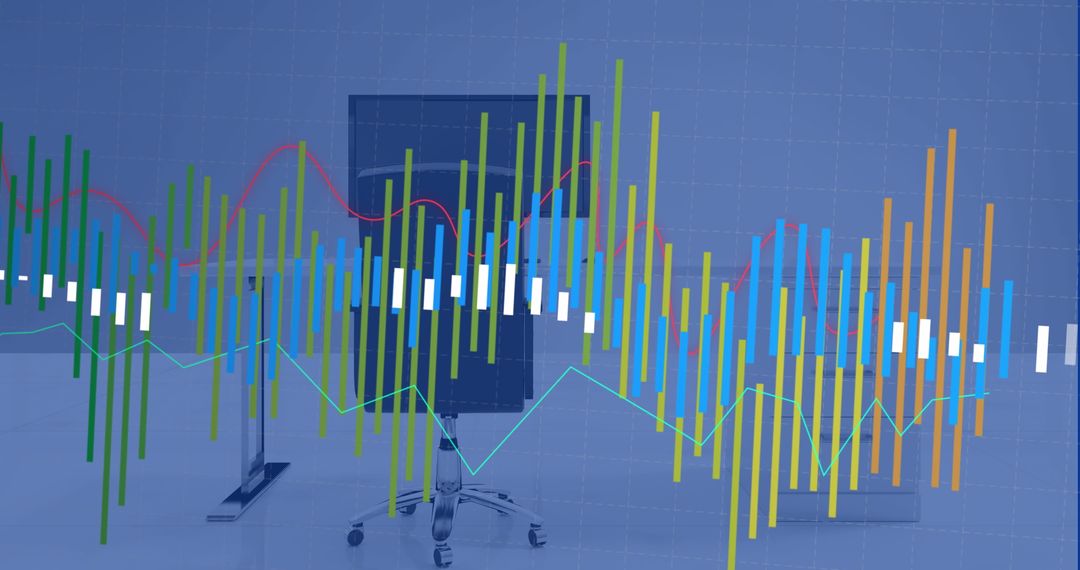
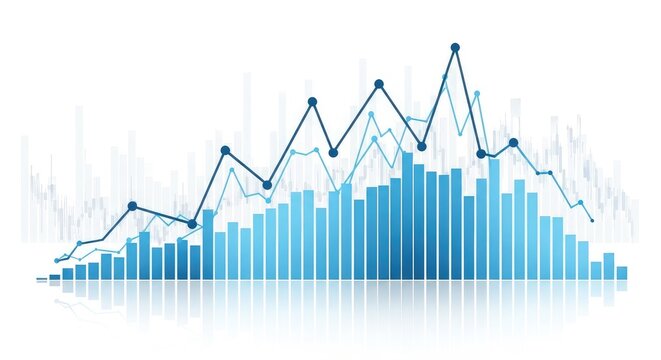
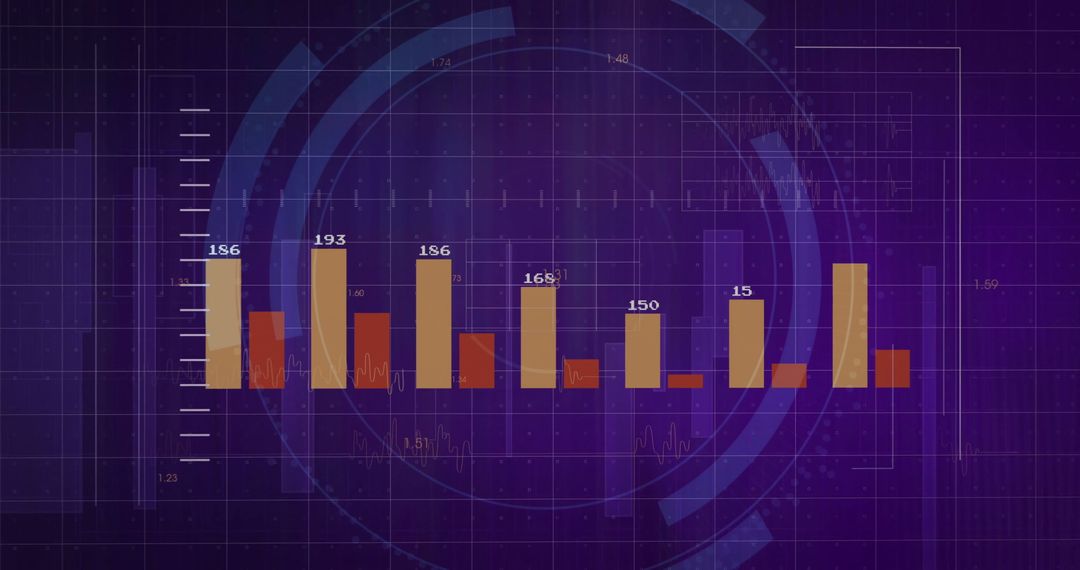
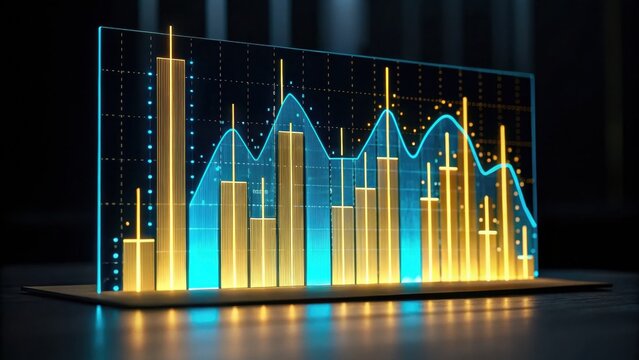
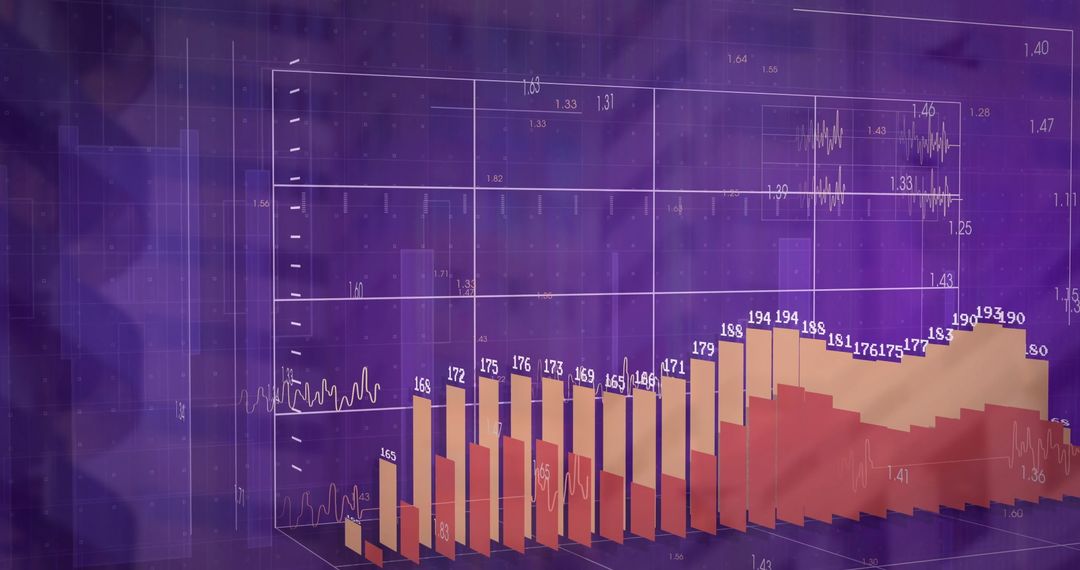
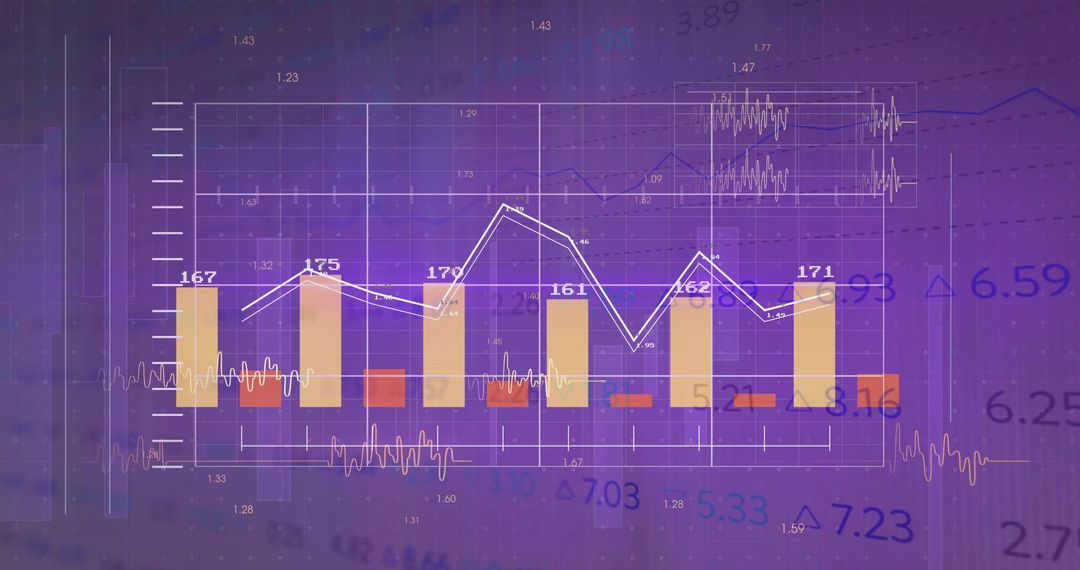
- Futuristic Digital Dashboard with 3D Bar and Line Charts
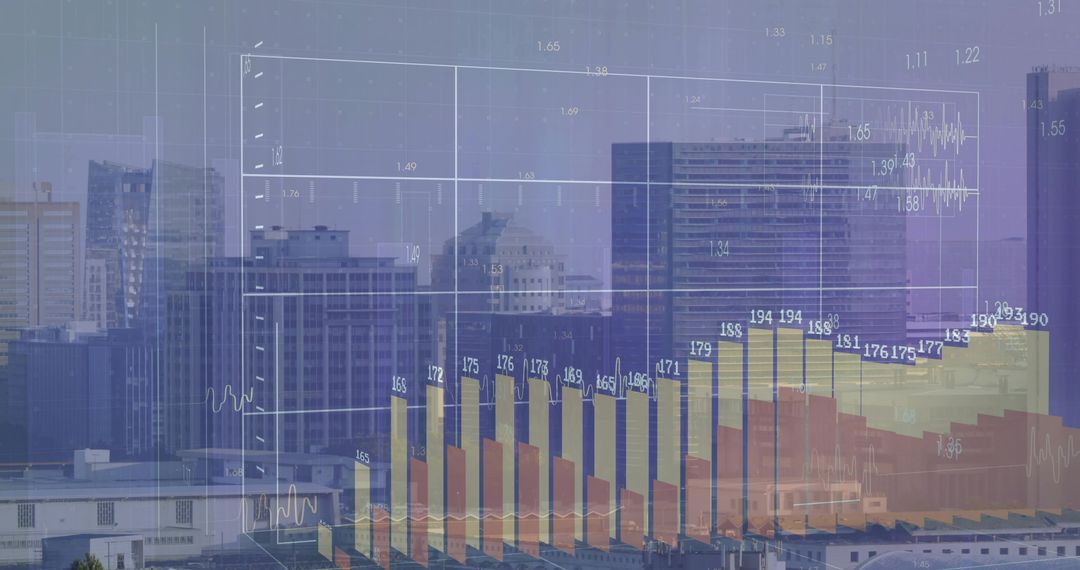
Futuristic Digital Dashboard with 3D Bar and Line Charts Image
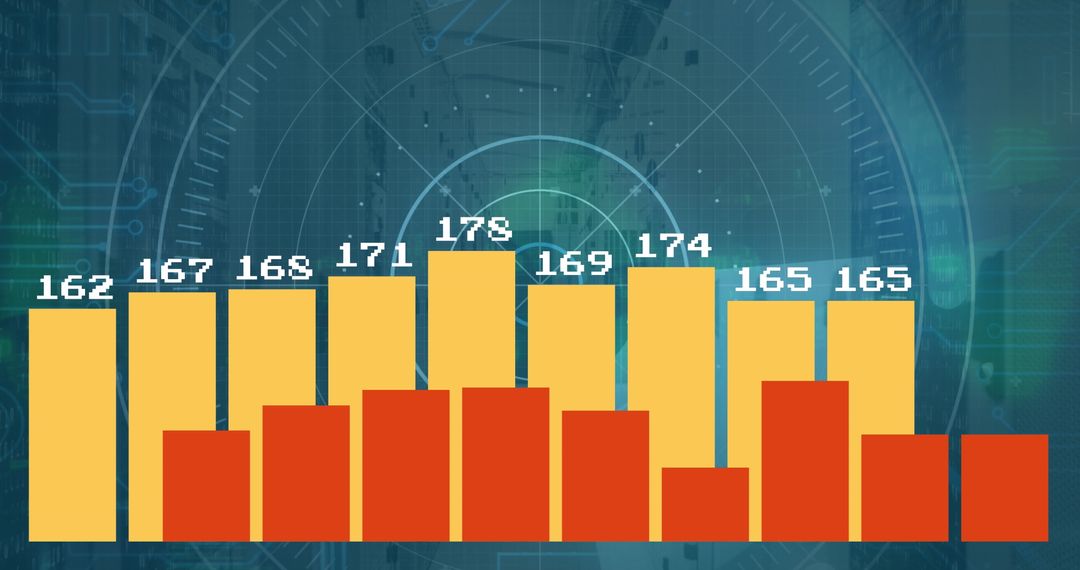
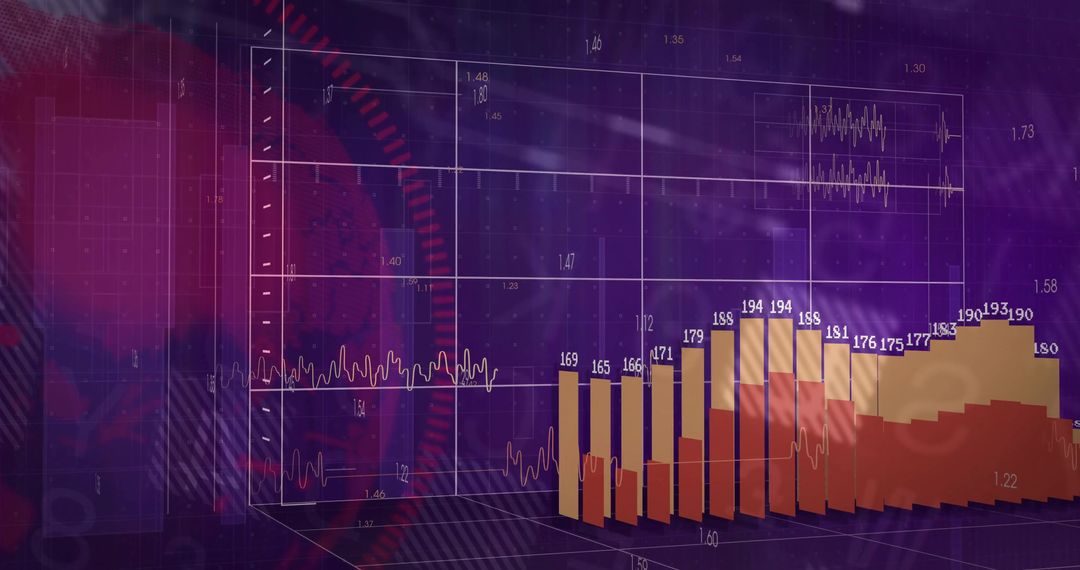
The image illustrates a digital dashboard featuring a 3D bar chart integrated with a line graph, all set against a futuristic background. The analytical visual represents data insights ideal for business reports, academic presentations, and technology-focused discussions showing trend analysis. Suitable for use in articles on data analytics, technological advancements in data visualization, and AI-driven reports in the fintech space.
Powered by 


2
downloads
downloads
Tags:
More
Credit Photo
If you would like to credit the Photo, here are some ways you can do so
Text Link
photo Link
<span class="text-link">
<span>
<a target="_blank" href=https://pikwizard.com/photo/futuristic-digital-dashboard-with-3d-bar-and-line-charts/1e124d4ba7260c120a0f102316f423ca/>PikWizard</a>
</span>
</span>
<span class="image-link">
<span
style="margin: 0 0 20px 0; display: inline-block; vertical-align: middle; width: 100%;"
>
<a
target="_blank"
href="https://pikwizard.com/photo/futuristic-digital-dashboard-with-3d-bar-and-line-charts/1e124d4ba7260c120a0f102316f423ca/"
style="text-decoration: none; font-size: 10px; margin: 0;"
>
<img src="https://pikwizard.com/pw/medium/1e124d4ba7260c120a0f102316f423ca.jpg" style="margin: 0; width: 100%;" alt="" />
<p style="font-size: 12px; margin: 0;">PikWizard</p>
</a>
</span>
</span>
Free (free of charge)
Free for personal and commercial use.
Author: People Creations
Similar Free Stock Images

Premium


Premium


Premium


Premium


Premium


Premium


Premium


Premium


Premium

Premium


Premium


Premium


Premium


Premium


Premium


Premium


Premium


Premium


Premium


Premium


Premium


Premium


Premium

Premium