
- Home >
- Stock Photos >
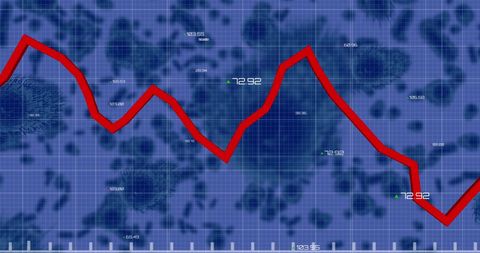
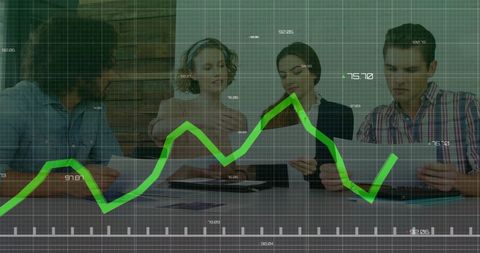
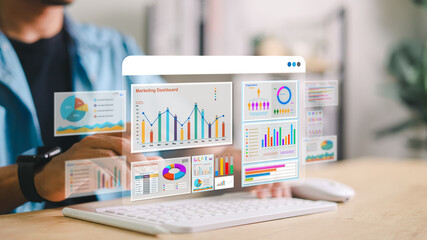
- Futuristic Digital Dashboard with Business Data Analytics
Futuristic Digital Dashboard with Business Data Analytics Image

This image visualizes a modern digital interface with various financial and analytical graphs overlaying a black background. It represents concepts such as business data analysis, economic forecasting, global communication, and technology-driven insights. Useful for conveying themes related to digital transformation, fintech solutions, or business strategy presentations.
Powered by 


downloads
Tags:
More
Credit Photo
If you would like to credit the Photo, here are some ways you can do so
Text Link
photo Link
<span class="text-link">
<span>
<a target="_blank" href=https://pikwizard.com/photo/futuristic-digital-dashboard-with-business-data-analytics/9502ca579403e583c38958ff0d24d65b/>PikWizard</a>
</span>
</span>
<span class="image-link">
<span
style="margin: 0 0 20px 0; display: inline-block; vertical-align: middle; width: 100%;"
>
<a
target="_blank"
href="https://pikwizard.com/photo/futuristic-digital-dashboard-with-business-data-analytics/9502ca579403e583c38958ff0d24d65b/"
style="text-decoration: none; font-size: 10px; margin: 0;"
>
<img src="https://pikwizard.com/pw/medium/9502ca579403e583c38958ff0d24d65b.jpg" style="margin: 0; width: 100%;" alt="" />
<p style="font-size: 12px; margin: 0;">PikWizard</p>
</a>
</span>
</span>
Free (free of charge)
Free for personal and commercial use.
Author: Creative Art
Similar Free Stock Images

Premium


Premium

Premium


Premium


Premium

Premium


Premium


Premium


Premium

Premium


Premium


Premium


Premium


Premium


Premium


Premium


Premium

Premium


Premium


Premium


Premium

Premium


Premium


Premium


Premium


Explore More Free Stock Images