1. Home > 
  2. Stock Photos > 
  3. Futuristic Digital Dashboard with Dynamic Data Analytics

Futuristic Digital Dashboard with Dynamic Data Analytics Image

Futuristic Digital Dashboard with Dynamic Data Analytics

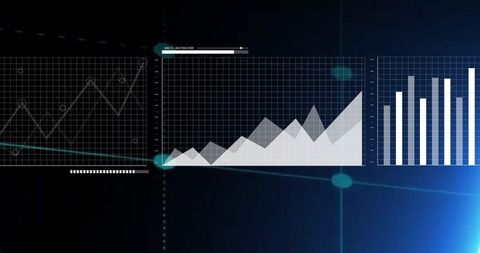
This high-tech design of a digital dashboard captures the essence of modern data visualization, highlighting trends and physical network connection simulations. Ideal for technology, finance sector presentations, or website applications showcasing futuristic designs or analytics processes. Utilize in cyber innovation discussions or technology product brochures to enhance storytelling with a polished, contemporary touch.

Powered by Shutterstock logo - Get 15% off with code: PIKWIZARD15
Man look at the dashboard with graphs and charts. Concept of data management system, business intelligence, data statistics, marketing analysis, key performance indicators (KPI) and analytics. - Powered by Shutterstock - Get 15% off with code: PIKWIZARD15Businessman using digital tablet with futuristic 2026 interface, holographic charts, infographics on blue background, concept of strategy planning - Powered by Shutterstock - Get 15% off with code: PIKWIZARD15Futuristic Digital Growth Chart – 3D Bar Graph with Glowing Blue Data Visualization - Powered by Shutterstock - Get 15% off with code: PIKWIZARD15Analyzing Key Performance Indicators. Businessman using digital screen to analyze key performance indicators (KPI) with various graphs and charts, showcasing data analysis and performance tracking. - Powered by Shutterstock - Get 15% off with code: PIKWIZARD15Business finance data analytics graph.Financial management technology.Advisor using KPI Dashboard on virtual screen. - Powered by Shutterstock - Get 15% off with code: PIKWIZARD15

Credit Photo

If you would like to credit the Photo, here are some ways you can do so

Free (free of charge)

Free for personal and commercial use.

Author: Awesome Content

Similar Free Stock Images

Financial Data Analysis with Bar and Line Graphs
Premium
Data analytics automated with AI technology. Businessman use laptop and dashboard for Automating Data Management Analytics and Business Reports with KPI. AI chat bot. Database. Sales. Marketing.
Digital Financial Data Analysis with Global Connections Theme
Business Chart with Declining Graph and Red Arrow
Futuristic Digital Financial Data Analytics with Graphs
Abstract Data Graph Infographic on Purple Gradient Background
Premium
Businessman using futuristic user interface with virtual data analytics. Innovative dashboard with financial charts, graphs, and global network information for business intelligence.
Abstract Financial Data Chart with Light Trails
Financial Chart Analysis and Data Visualization Concept
Digital Analysis of Financial Trends and Global Economy Data
Abstract Financial Graph and Data Analysis Background
Premium
Business finance data analytics graph.Financial management technology.Advisor using KPI Dashboard on virtual screen.
Abstract Financial Market Analysis with Candlestick and Bar Charts
Futuristic Digital Graphs and Lens Flare Illustrate Data Trends
Graph Showing Stock Market Activity and Financial Data Analysis
Digital Stock Market Analysis with Graphs and Charts
Premium
business interacting with futuristic digital dashboard featuring project timelines, analytics, data visualization elements. Perfect for themes of workflow management, technology, digital efficiency.
Futuristic Visualization of Financial Data and Statistics
Digital Bar Graph on Dark Global Business Interface
Abstract Data Visualization with Interface Charts and Graphs
Bar Graph with Downward Trend and Heartbeat Line
Premium
Businessman analyzing virtual data charts and digital graphs with futuristic interface on dark background, concept of analytics and fintech
Financial Data Analysis with Graphs and Charts on Dark Background
Digital Financial Data with Graphs and Charts on Blue Background
Innovative Data Analysis over DNA Strand
Digital Interface with Data Processing and Graphs
Premium
Business professional interacting with futuristic digital dashboard featuring charts, analytics, global map, and performance metrics, representing data visualization, big data analysis, and modern.
Digital Financial Trading Dashboard with Data Visualization
Blue Bar Chart with Downward Pink Arrow Showing Data Trend
Futuristic Financial Charts Over Night Urban Skyline
Neon Line Graph on Trading Interface Displaying Data Analysis
Digital Financial Data Stream with Numeric Overlay
Global Financial Data Visualization with Charts and Graphs
Premium
Data analytics automated with AI technology. Big data, business analytics and artificial intelligence automation. Dashboard report with sales and operations charts and KPI insights on touch screen.
Declining Financial Forecast with Digital Interface
Financial Charts with Upward Trend and Analysis Tools
Digital Data Graphs with Blue Background and Light Flare
Abstract Triangular Shape over Stock Market Data Visualization
Premium
Businessman using computer for development and Analytics Data technology management System for report marketing strategy planning. graph analysis and information on a futuristic virtual screen.
Digital Display of Financial Data Analytics and Graphs
Dynamic Global Finance Data with Digital Graphs
Digital Financial Data Interface on Green Background
Financial Data Analysis Graph with Growing Trends
Premium
Businesswoman using digital tablet with analytics data chart, Business management and technology concept.
Futuristic HUD Interface for Data Analysis and Finance
Dynamic Financial Data Charts Histogram
Digital Financial Data and Statistics Analyzing Concept
Global Network Analysis with Dynamic Digital Data
Premium
Digital approval and task management with futuristic interface. Businessman using stylus on tablet to complete checklist, analyze data on smart dashboard. Concept of workflow automation, e-signature.
Abstract Digital Financial Charts and Graphs Interface
Futuristic Digital Display with Dynamic Charts and Graphs
Digital Stock Market Analysis With City Background
Financial Data Processing in Digital Environment
Premium
Business professional working on a laptop with futuristic digital dashboards displaying analytics, financial data, charts, and global metrics, highlighting advanced data analysis and innovation.
Financial Data Analytics on Digital Interface
Abstract Financial Data Charts with Analytics and Trends
Dynamic Financial Data Growth Chart Display
Dynamic Digital Interface Displaying Financial Data Analysis
Premium
Businessman holding tablet with futuristic digital dashboard displaying data analytics, charts, and world map visualization. Concept of business intelligence, big data, and technology innovation.
Advanced Digital Data Analytics and Visualization Dashboard
Futuristic Cybersecurity Terminal with Code and Graphs
Abstract Financial Growth Chart with Rising Bars and Line Graphs
Abstract Financial Data and Numbers in Virtual Environment
Global Financial Data Interaction and Digital Analytics
Digital Charts and Financial Data Background in Blue Tones
Premium
Businessman analyzes data using AI technology to work with tools, Chatbot data or chat with AI with Robot. Concept, AI smart robot technology, artificial intelligence, helping to solve work problems.
Abstract Financial Data Visualization on Tech Background
Digital Graph with Abstract Data on Blue Background
Financial Data Analytics in Digital Interface Design
Digital Financial Analytics with Zero Percent Concept
Premium
Business analysis big data screen and economic growth with financial graph. Concept of virtual dashboard technology digital marketing and global economy network connection. 3D illustration.
Dynamic Financial Data and Graphs on Digital Interface
Financial Data Charts and Graphs on Digital Interface
Financial Data and Graphs on Digital Blue Background
Abstract Digital Data Interface Visualization for Analytics
Premium
A futuristic digital interface displaying KYC forms, approval checkmarks, and analytics charts. Hand interacting with touch-sensitive elements. KYC concept
Financial Data Processing Over Digital Cityscape
Colombian Flag Merging with Stock Market Graphs Illustrating Economy
Digital Screen Displaying Stock Market Index Data Trends
Animated Financial Chart Depicting Stock Market Trends
Premium
Business analysis big data sciences and economic growth with financial graph. Concept of fintech virtual dashboard technology digital marketing and global economy investment . 3D illustration banner.
Digital Data Interface with Analyzing System Graphs
Rising Statistical Data Visualization and Analysis
Futuristic Data Patterns with Global Connections
Data Visualization with Graphs and Charts on Black Background
Premium
Displaying circular HUD pulsing over green PCB in virtual control, showing neon traces and nodes. Ring, interface, circuitry, futuristic, digital, dashboard, technology
Cybersecurity Analytics: Data Graph and Digital Lock Interface
Global Financial Data Processing with Graphs and Charts on Dark Background
Dynamic Financial Data Trends with Fluctuating Graphs and Charts
Analytics Dashboard with Dynamic Financial Data Visualization
Premium
Businessman working on laptop with futuristic digital dashboard interface, representing data analytics, technology management, cybersecurity, and modern business innovation in the digital era.
Futuristic Data Dashboard with Neon 3D Visualizations
Digital market analytics dashboard showing red and blue trend lines with percent labels
Digital Financial Graphs and Charts on Dark Background
Digital Data Visualization in Global Business Context
Analyzing Financial Downtrend with Digital Data Concepts
Dynamic Display of Real-Time Data and Digital Analytics
Premium
Professional Using AI-Powered Laptop and Smartphone to Analyze Data Insights and Marketing Analytics with Holographic Graphs and Infographics, Showcasing Advanced Technology and Future Digital
Digital Financial Data Analytics Wand Big Affect SEO Tools Commercial
Data streams, digital interface for global business innovation
Digital Data Visualization on Dark Background
Advanced Financial Data and Chemical Structures Processing
Premium
Hand typing laptop futuristic digital dashboard displaying data points analytics charts interface elements representing data analysis business intelligence technology innovation digital transformation
Digital Interface with Data Visualization and Analytics Elements
Financial Data Visualization with Line and Bar Graphs
Growth Charts and Data Analysis Visual Illustration
Analyzing Financial Graphs with Real-Time Data Trends
Premium
Advisor using KPI Dashboard on virtual screen.Business finance data analytics graph.Financial management technology.
Stock Market Data Visuals Displaying Financial Analysis Trends
Abstract Financial Charts with Colorful Holographic Effects
Dynamic Financial Graphs with Glowing Lens Flares and Data Points
Financial Analytics with Chart and Graph Overlay on Digital Background
Premium
A business professional interacting with a futuristic digital dashboard displaying analytics charts data visualizations, and performance metrics symbolizing data-driven decisions and modern corporate.
Digital Data Visualization with Graph Charts on Dark Background
Digital Financial Graphs and Data Analysis Visualization
Digital Fintech Visualization with Graphs and Data Icons
Digital Interface with Graphs and Data Overlaid on Building
Premium
A close-up view of a user interacting with a futuristic digital dashboard displaying various data metrics and visualizations, ideal for illustrating modern data analysis concepts.
Digital Stock Market Data with Upward Trend Graph
Financial Data Processing on Digital Graph Displayed on Screen
Futuristic Data Visualization with Dynamic Graphs
Digital Trading Analysis with Graphs and Trendlines
Premium
Businessman using futuristic digital dashboard interface with data analytics, graphs, and global network visualization. Concept of big data, business intelligence, and technology innovation.
Futuristic Data Dashboard with Bar Chart, Sine Wave Line, Gauge and Map Overlay