
- Home >
- Stock Photos >
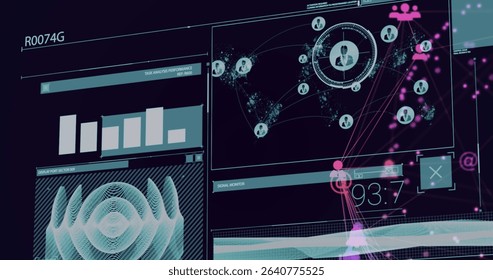
- Futuristic Digital Dashboard with Insightful Data Visualization
Futuristic Digital Dashboard with Insightful Data Visualization Image

The image showcases a futuristic digital dashboard displaying trend lines and bar graphics detailed in cyan and purple. Overlayed globes and data markers enhance the high-tech visualization of analytics. This visual can be effectively used for depicting economic forecasts, tech presentations, cybersecurity systems, or futuristic themes in advertising material.
Powered by  - Get 15% off with code: PIKWIZARD15


downloads
Tags:
More
Credit Photo
If you would like to credit the Photo, here are some ways you can do so
Text Link
photo Link
<span class="text-link">
<span>
<a target="_blank" href=https://pikwizard.com/photo/futuristic-digital-dashboard-with-insightful-data-visualization/cc3e931f1562e170e836ad467f628cb0/>PikWizard</a>
</span>
</span>
<span class="image-link">
<span
style="margin: 0 0 20px 0; display: inline-block; vertical-align: middle; width: 100%;"
>
<a
target="_blank"
href="https://pikwizard.com/photo/futuristic-digital-dashboard-with-insightful-data-visualization/cc3e931f1562e170e836ad467f628cb0/"
style="text-decoration: none; font-size: 10px; margin: 0;"
>
<img src="https://pikwizard.com/pw/medium/cc3e931f1562e170e836ad467f628cb0.jpg" style="margin: 0; width: 100%;" alt="" />
<p style="font-size: 12px; margin: 0;">PikWizard</p>
</a>
</span>
</span>
Free (free of charge)
Free for personal and commercial use.
Author: People Creations
Similar Free Stock Images

Premium


Premium


Premium


Premium


Premium


Premium


Premium


Premium

Premium

Premium


Premium


Premium


Premium


Premium

Premium


Premium

Premium


Premium


Premium


Premium


Premium


Premium


Premium


Premium


Premium


Explore More Free Stock Images