
- Home >
- Stock Photos >
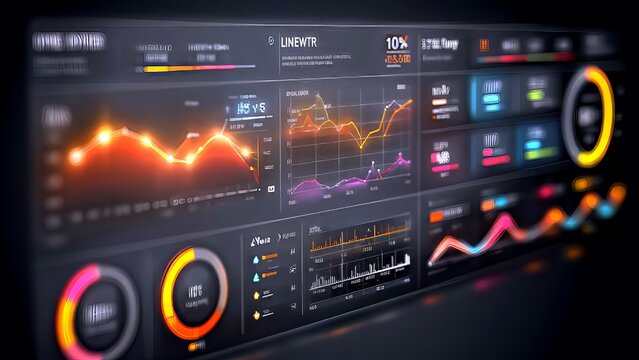
- Futuristic Digital Dashboard with Interactive Data Charts
Futuristic Digital Dashboard with Interactive Data Charts Image

Futuristic digital dashboard featuring interactive charts and data analytics is ideal for illustrating concepts of business intelligence, technology integration, and future-focused planning. The presence of a 3D globe enhances the global aspect of technology applications. Perfect for use in presentations, videos, or articles discussing digital transformation, user experience in data handling, or emphasizing technological advancements in business environments.
Powered by 


downloads
Tags:
More
Credit Photo
If you would like to credit the Photo, here are some ways you can do so
Text Link
photo Link
<span class="text-link">
<span>
<a target="_blank" href=https://pikwizard.com/photo/futuristic-digital-dashboard-with-interactive-data-charts/ab5d8abe73308263ae39998f83a62b0e/>PikWizard</a>
</span>
</span>
<span class="image-link">
<span
style="margin: 0 0 20px 0; display: inline-block; vertical-align: middle; width: 100%;"
>
<a
target="_blank"
href="https://pikwizard.com/photo/futuristic-digital-dashboard-with-interactive-data-charts/ab5d8abe73308263ae39998f83a62b0e/"
style="text-decoration: none; font-size: 10px; margin: 0;"
>
<img src="https://pikwizard.com/pw/medium/ab5d8abe73308263ae39998f83a62b0e.jpg" style="margin: 0; width: 100%;" alt="" />
<p style="font-size: 12px; margin: 0;">PikWizard</p>
</a>
</span>
</span>
Free (free of charge)
Free for personal and commercial use.
Author: Awesome Content
Similar Free Stock Images

Premium


Premium

Premium


Premium


AI


Premium


Premium


Premium

Premium

Premium


Premium

Premium


Premium


Premium


Premium


Premium


Premium

Premium

Premium


Premium


Premium


Premium


Premium


Premium


Premium


Premium

Explore More Free Stock Images