
- Home >
- Stock Photos >
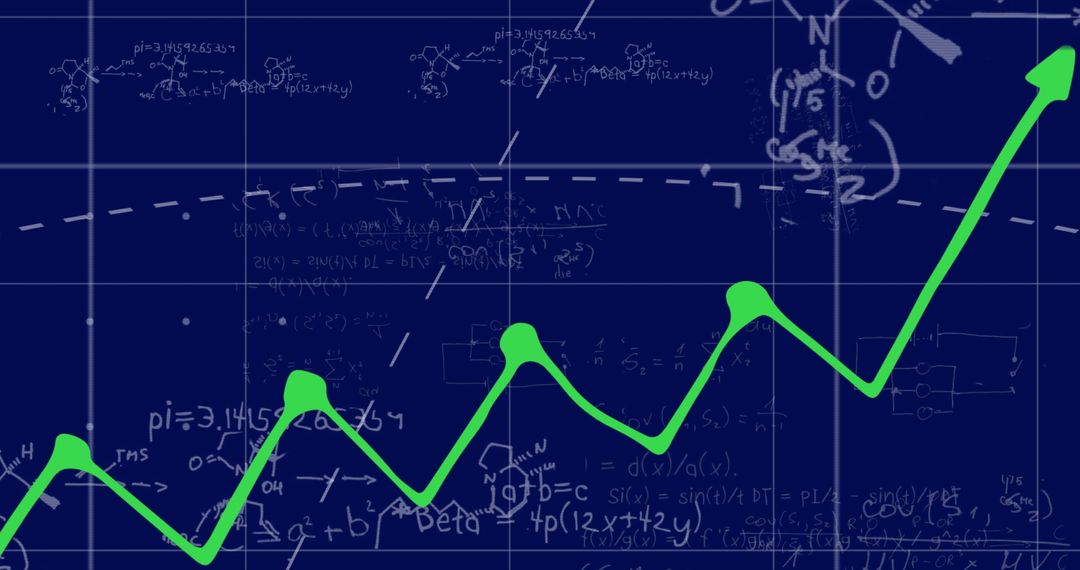
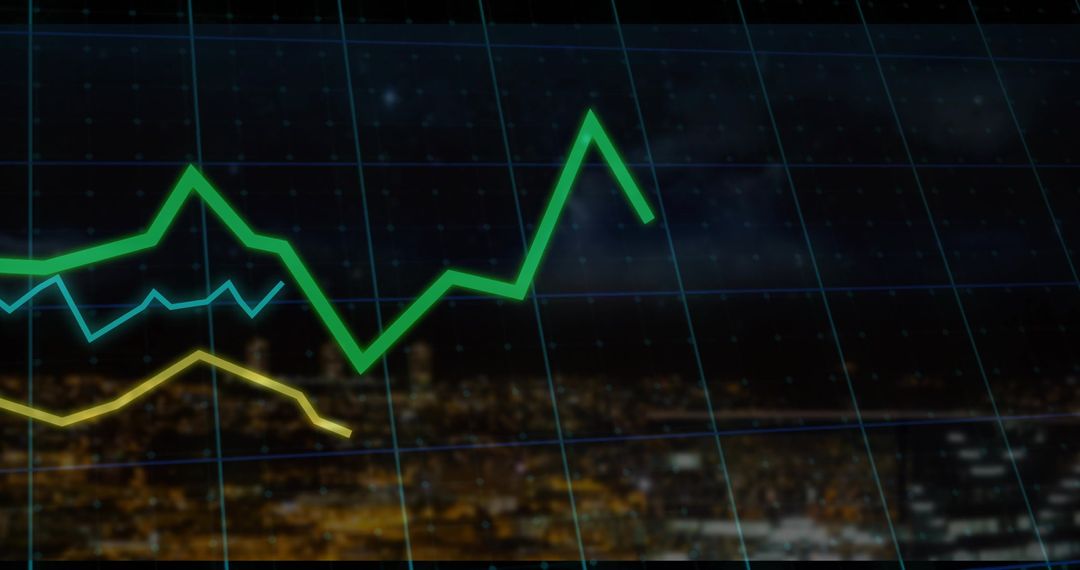
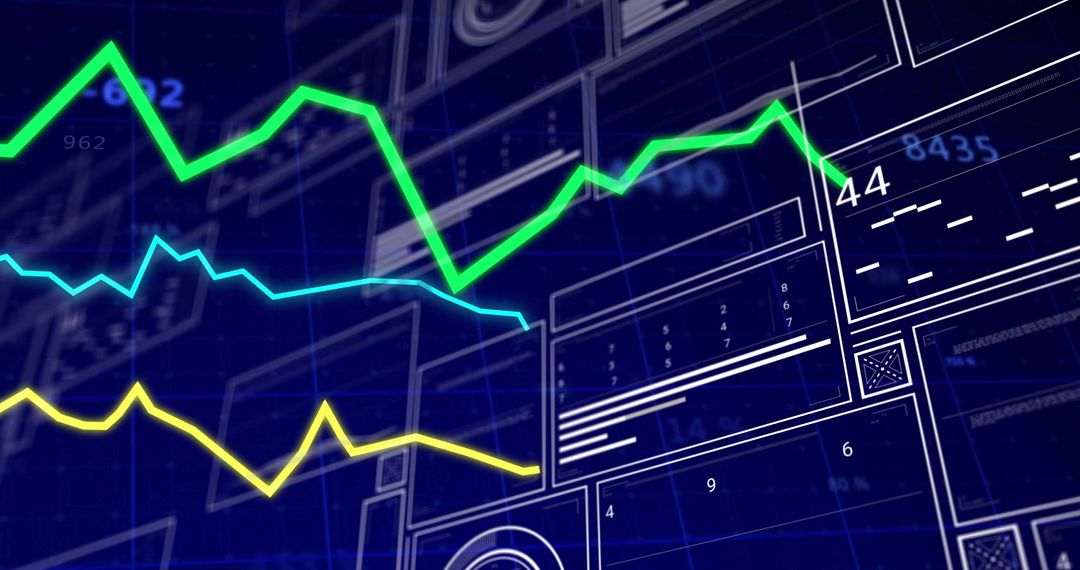
- Futuristic Digital Dashboard with Neon Line Charts Analysis
Futuristic Digital Dashboard with Neon Line Charts Analysis Image

Visual represents complex data displays with interactive line charts in neon colors, common in technology or analytical presentations. Ideal for illustrating concepts in digital innovation, cybersecurity methods, data analysis processes, or technological advancements.
Powered by  - Get 15% off with code: PIKWIZARD15


0
downloads
downloads
Tags:
More
Credit Photo
If you would like to credit the Photo, here are some ways you can do so
Text Link
photo Link
<span class="text-link">
<span>
<a target="_blank" href=https://pikwizard.com/photo/futuristic-digital-dashboard-with-neon-line-charts-analysis/b423f7ea5183fd282d54903063ebd190/>PikWizard</a>
</span>
</span>
<span class="image-link">
<span
style="margin: 0 0 20px 0; display: inline-block; vertical-align: middle; width: 100%;"
>
<a
target="_blank"
href="https://pikwizard.com/photo/futuristic-digital-dashboard-with-neon-line-charts-analysis/b423f7ea5183fd282d54903063ebd190/"
style="text-decoration: none; font-size: 10px; margin: 0;"
>
<img src="https://pikwizard.com/pw/medium/b423f7ea5183fd282d54903063ebd190.jpg" style="margin: 0; width: 100%;" alt="" />
<p style="font-size: 12px; margin: 0;">PikWizard</p>
</a>
</span>
</span>
Free (free of charge)
Free for personal and commercial use.
Author: People Creations
Similar Free Stock Images

Premium


Premium


Premium


Premium


Premium


Premium


Premium


Premium


Premium


Premium


Premium


Premium


Premium


Premium


Premium


Premium


Premium


Premium


Premium


Premium


Premium


Premium


Premium


Premium
