
- Home >
- Stock Photos >
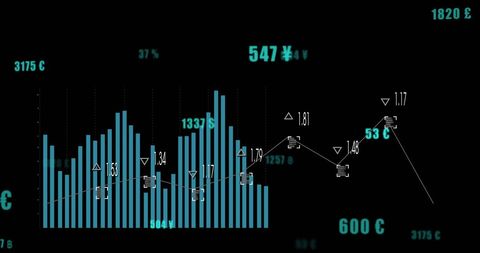
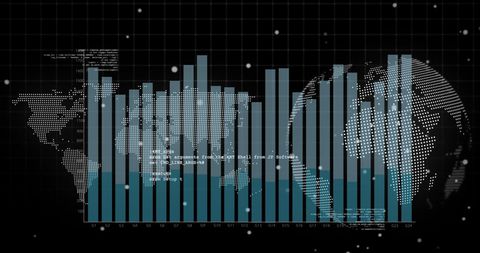
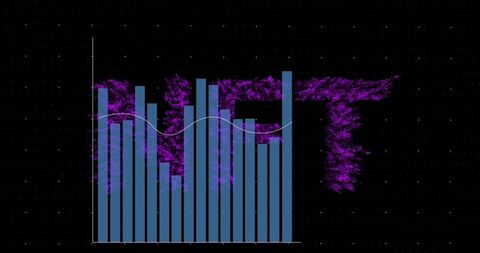
- Futuristic Digital Data Analysis Interface on Black Background
Futuristic Digital Data Analysis Interface on Black Background Image

Graphic depicting digital data analysis tools with charts and graphs. Ideal for illustrating technology efficiency, data-centric operations, and business analysis. Useful in articles, presentations, and campaigns focusing on digital transformation, modern analytics, and tech interfaces.
Powered by 


downloads
Tags:
More
Credit Photo
If you would like to credit the Photo, here are some ways you can do so
Text Link
photo Link
<span class="text-link">
<span>
<a target="_blank" href=https://pikwizard.com/photo/futuristic-digital-data-analysis-interface-on-black-background/af581f1b0a16d34ff2d6cb9a11d37a0e/>PikWizard</a>
</span>
</span>
<span class="image-link">
<span
style="margin: 0 0 20px 0; display: inline-block; vertical-align: middle; width: 100%;"
>
<a
target="_blank"
href="https://pikwizard.com/photo/futuristic-digital-data-analysis-interface-on-black-background/af581f1b0a16d34ff2d6cb9a11d37a0e/"
style="text-decoration: none; font-size: 10px; margin: 0;"
>
<img src="https://pikwizard.com/pw/medium/af581f1b0a16d34ff2d6cb9a11d37a0e.jpg" style="margin: 0; width: 100%;" alt="" />
<p style="font-size: 12px; margin: 0;">PikWizard</p>
</a>
</span>
</span>
Free (free of charge)
Free for personal and commercial use.
Author: Creative Art
Similar Free Stock Images

Premium


Premium


Premium


Premium


Premium


Premium


Premium


Premium


Premium


Premium


Premium


Premium


Premium


Premium

Premium


Premium


Premium

Premium


Premium


Premium


Premium


Premium

Premium


Premium

Premium


Explore More Free Stock Images