
- Home >
- Stock Photos >
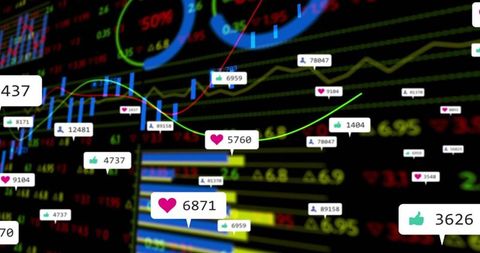
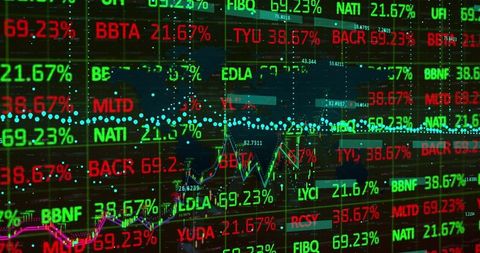
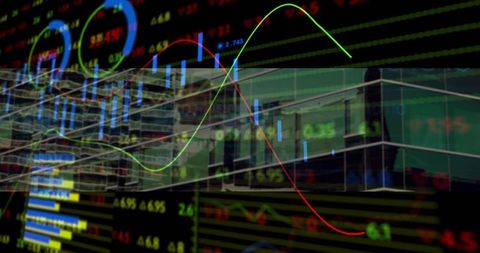
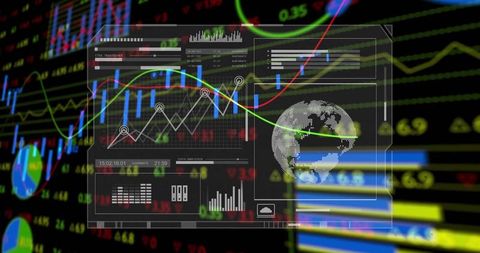
- Futuristic Digital Data Analysis with Codes and Graphs
Futuristic Digital Data Analysis with Codes and Graphs Image
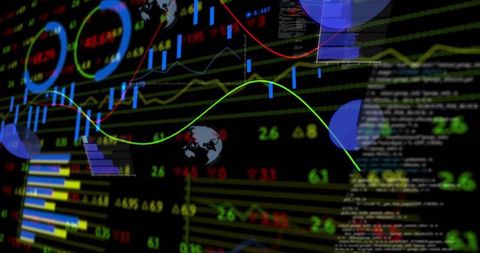
Colorful digital graphs and code interface showcasing active financial trading. Neon lines and visual patterns indicate dynamic data analysis. Perfect for content on financial technology, digital markets, or stock trading platforms. Useful in articles concerning innovation in fintech, data sourcing for trading software, or illustrating progressive economic tools.
Powered by 


downloads
Tags:
More
Credit Photo
If you would like to credit the Photo, here are some ways you can do so
Text Link
photo Link
<span class="text-link">
<span>
<a target="_blank" href=https://pikwizard.com/photo/futuristic-digital-data-analysis-with-codes-and-graphs/ffdf29a115305d84b4a51f43ad014302/>PikWizard</a>
</span>
</span>
<span class="image-link">
<span
style="margin: 0 0 20px 0; display: inline-block; vertical-align: middle; width: 100%;"
>
<a
target="_blank"
href="https://pikwizard.com/photo/futuristic-digital-data-analysis-with-codes-and-graphs/ffdf29a115305d84b4a51f43ad014302/"
style="text-decoration: none; font-size: 10px; margin: 0;"
>
<img src="https://pikwizard.com/pw/medium/ffdf29a115305d84b4a51f43ad014302.jpg" style="margin: 0; width: 100%;" alt="" />
<p style="font-size: 12px; margin: 0;">PikWizard</p>
</a>
</span>
</span>
Free (free of charge)
Free for personal and commercial use.
Author: Awesome Content
Similar Free Stock Images

Premium


Premium


Premium

Premium


Premium


Premium

Premium

Premium


Premium

Premium


Premium


Premium

Premium


Premium


Premium


Premium


Premium


Premium


Premium


Premium

Premium

Premium


Premium

Premium


Premium

Explore More Free Stock Images