- Home >
- Stock Photos >
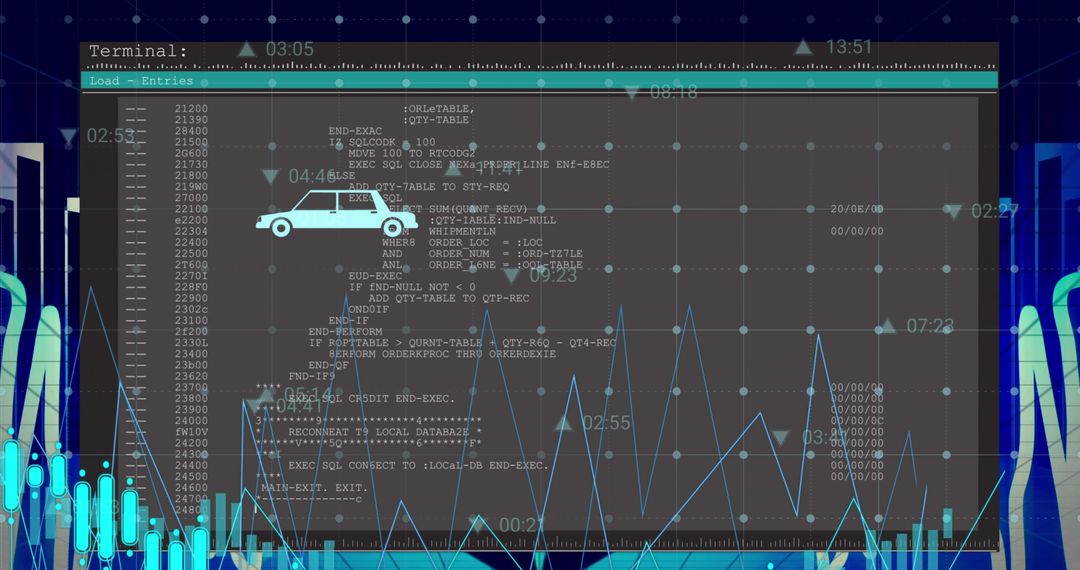
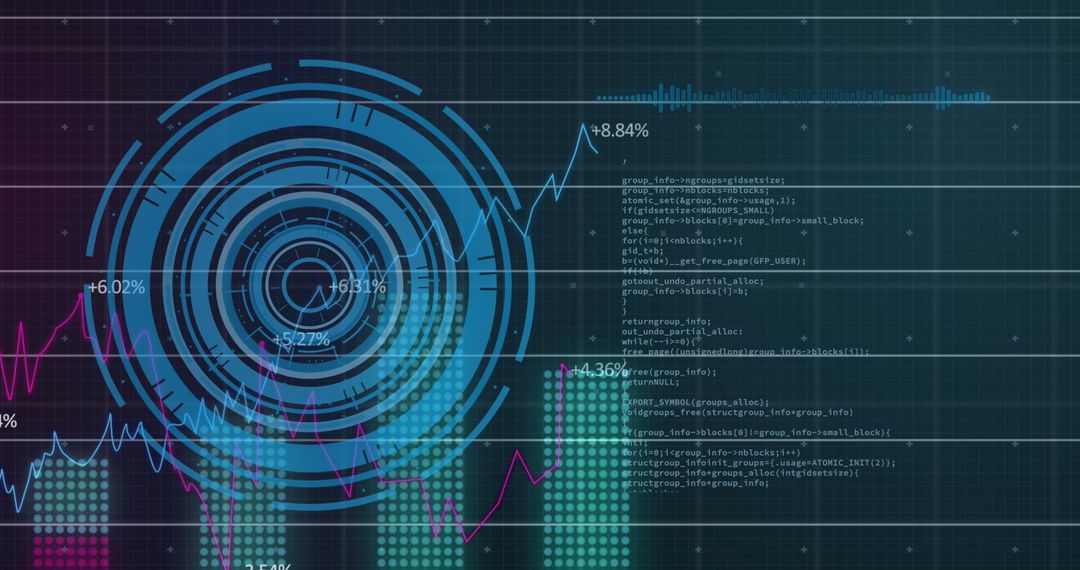
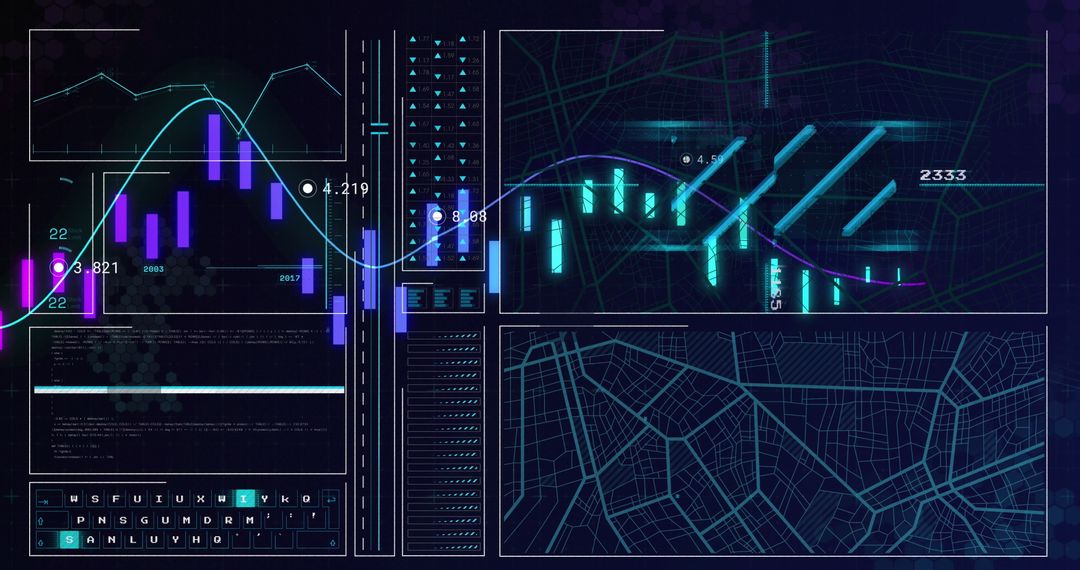
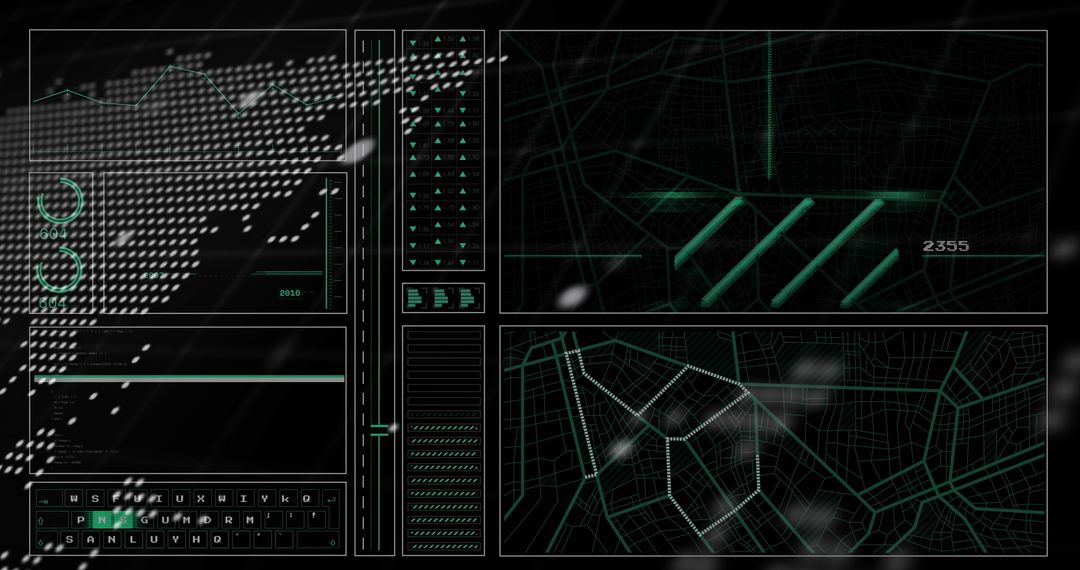
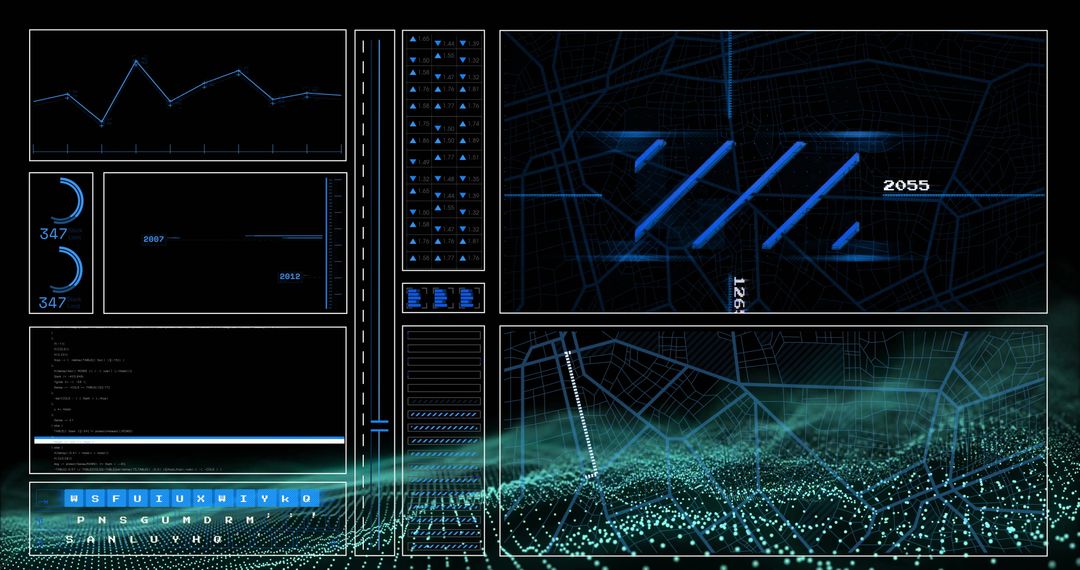
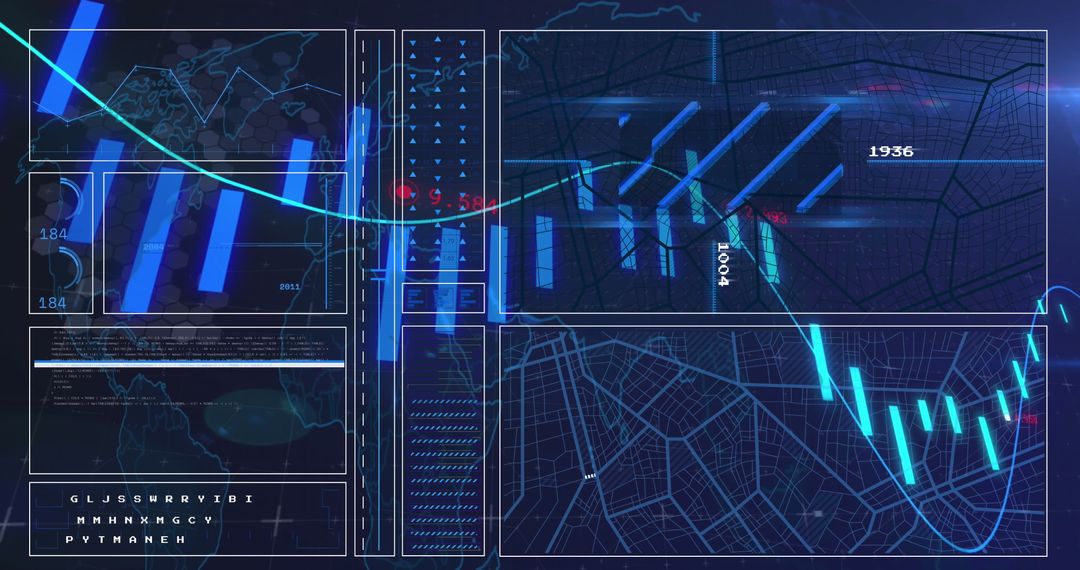
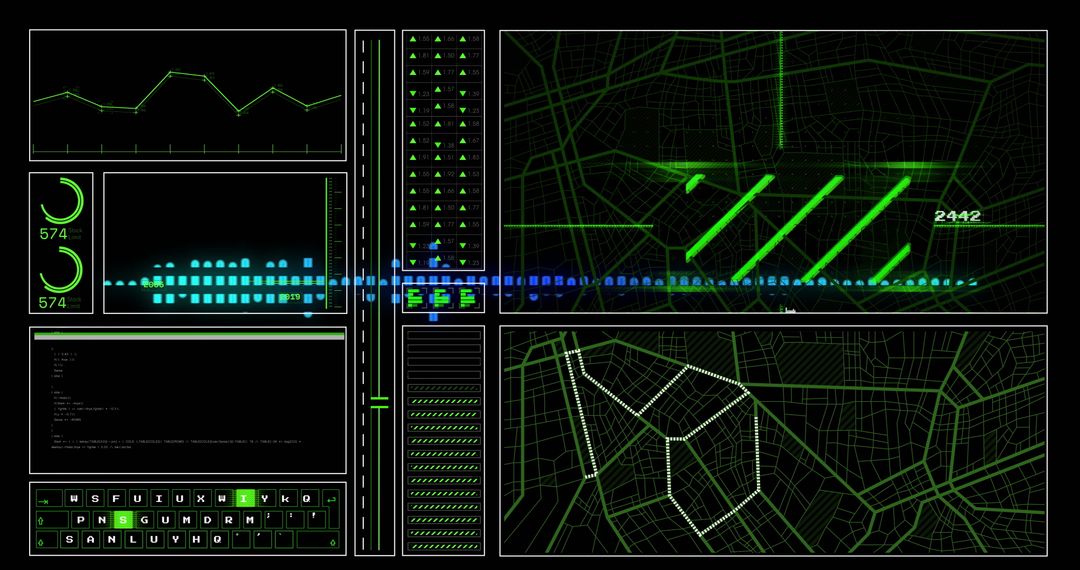
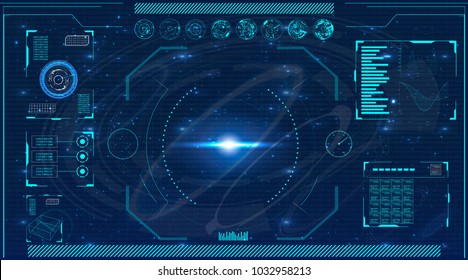
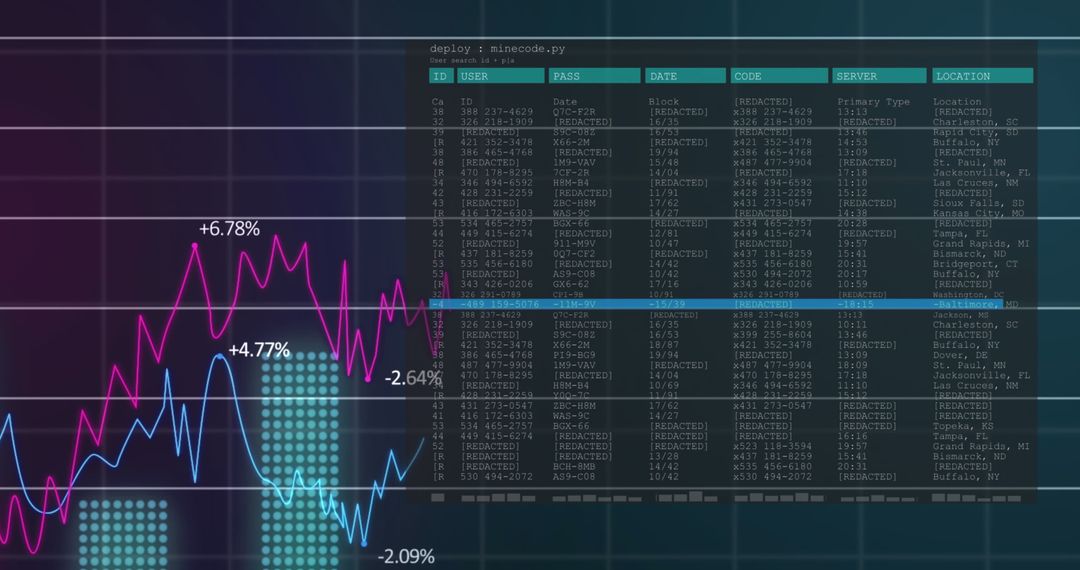
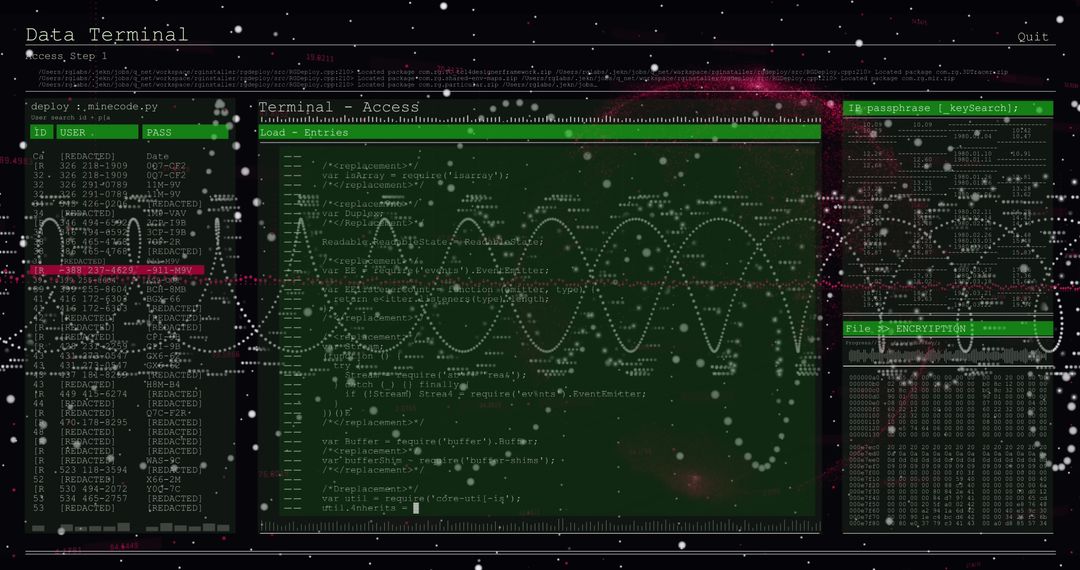
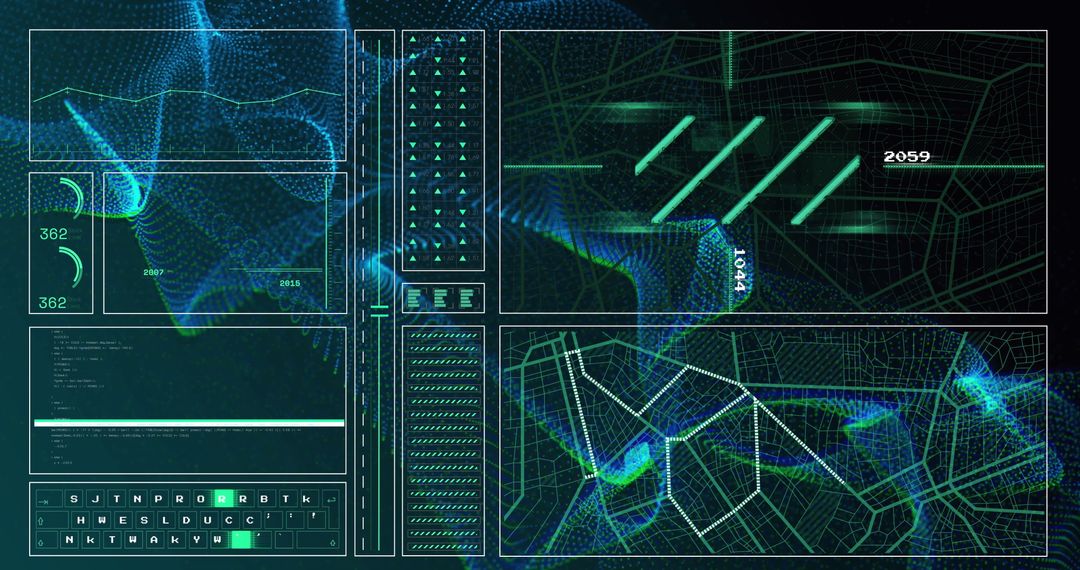
- Futuristic Digital Data Dashboard with Charts and Gauges
Futuristic Digital Data Dashboard with Charts and Gauges Image

Neon-blue display features dynamic circular gauges and line charts providing an advanced overview of data. Useful for depicting technology-driven sectors like big data analytics, software interfaces, and innovative data visualization concepts. Ideal for presentations around digital transformation, tech-forward reports, or illustrating a complex system, making the abstract phenomenon more tangible.
Powered by  - Get 15% off with code: PIKWIZARD15


0
downloads
downloads
Tags:
More
Credit Photo
If you would like to credit the Photo, here are some ways you can do so
Text Link
photo Link
<span class="text-link">
<span>
<a target="_blank" href=https://pikwizard.com/photo/futuristic-digital-data-dashboard-with-charts-and-gauges/c93f46e36c577db1a43ac8d39d3dffe6/>PikWizard</a>
</span>
</span>
<span class="image-link">
<span
style="margin: 0 0 20px 0; display: inline-block; vertical-align: middle; width: 100%;"
>
<a
target="_blank"
href="https://pikwizard.com/photo/futuristic-digital-data-dashboard-with-charts-and-gauges/c93f46e36c577db1a43ac8d39d3dffe6/"
style="text-decoration: none; font-size: 10px; margin: 0;"
>
<img src="https://pikwizard.com/pw/medium/c93f46e36c577db1a43ac8d39d3dffe6.jpg" style="margin: 0; width: 100%;" alt="" />
<p style="font-size: 12px; margin: 0;">PikWizard</p>
</a>
</span>
</span>
Free (free of charge)
Free for personal and commercial use.
Author: Awesome Content
Similar Free Stock Images

Premium


Premium


Premium


Premium


Premium


Premium


Premium


Premium


Premium


Premium


Premium


Premium


Premium


Premium


Premium


Premium


Premium


Premium


Premium


Premium


Premium


Premium


Premium


Premium