1. Home > 
  2. Stock Photos > 
  3. Futuristic Digital Data Dashboard with Interactive Graphs

Futuristic Digital Data Dashboard with Interactive Graphs Image

Futuristic Digital Data Dashboard with Interactive Graphs

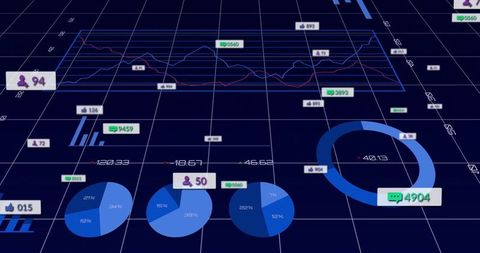
Image showcases a modern digital data dashboard with various interactive graphs including pie charts, a donut chart, and social media analytics icons on a grid-like plane. Ideal for illustrating articles or presentations on data analytics, business intelligence, technology trends, or user interaction driven by metrics.

Powered by Adobe logo
An analyst uses a computer and dashboard for data business analysis and Data Management System with KPI and metrics connected to the database for technology finance, operations, sales, marketing  - Powered by AdobeKPI analytics dashboard showing charts, performance metrics, AI insights and task checklists used by man on tablet for business data analysis, digital strategy planning and productivity management - Powered by AdobeFuturistic glowing blue digital dashboard with interactive charts graphs and analytics showing upward growth trend for business financial and technology data visualization concepts - Powered by AdobeData analyst working on business analytics dashboard with charts, metrics and KPI to analyze performance and create insight reports for operations management on virtual screen. - Powered by AdobeHovering wireframe keyboard in purple analytics space, with data sheets and binary sequences - Powered by Adobe

Credit Photo

If you would like to credit the Photo, here are some ways you can do so

Free (free of charge)

Free for personal and commercial use.

Author: People Creations

Similar Free Stock Images

Digital Financial Data Analysis Visualization with Charts
Premium
Sales data analysis dashboard showing performance, trends, and insights. Sales data tracks growth, supports decisions, sales data boosts strategy, and sales data drives performance. Latch
Futuristic Financial Data Visualization Overlaying City Silhouette
Premium
Futuristic data visualization with glowing graphs, holographic charts, and dynamic digital elements, conveying insight, analysis, and advanced technology in a sleek modern style.
Digital Planet and Data Processing Conceptual Grid
Futuristic Data Dashboard with Interactive Graphs and Analytics
Digital Financial Data Processing with Global Insights
Global Cybersecurity with Digital Data Graphics Background
Analyzing Business Data Amid COVID-19 Pandemic Era
Global Financial Data and Graphs Overlay on Cityscape
Global Financial Data Visualization with Charts on Digital Map
Futuristic Financial Data Analytics Interface with Graphs and Charts
Premium
Data science and business intelligence, Business data analytics, Analyst using big data dashboard for performance evaluation, KPI metrics, Strategic decision making with AI and technology.
Premium
Maximize business performance with innovative technology for increased deals using mobile apps and data driven insights for success in the digital age
Digital Financial Data Analysis and Networking
Social Media Engagement and Data Analysis Concepts
Digital Dashboard Showing Energy and Sustainability Analytics
Digital Data Processing with Financial Graphs and Charts
Premium
Businessman holding magnifying glass over digital checkboxes and analytics documents representing data verification and whitelist concept on dark background.
Digital Analytics Dashboard with Futuristic Data Visuals
Futuristic Data Visualization with Radar and Charts
Futuristic Digital Data Interface with Globe and Analytics
Global Data Processing with Futuristic Statistical Graphics
Premium
Machine learning finance performance metrics gear data technology cog concept analytics economy gently gear digital stock market chart background
Futuristic Digital Dashboard with 3D Graphs and Infographics
Visualizing Financial Data Analytics on Digital World Map
Digital Stock Market Data with Graphs and Percentages
Premium
Visual representation of digital marketing metrics and ads on a futuristic interface, showcasing data analysis through charts and graphs in a modern business setting. Gantry
Premium
Personalized Marketing Strategy. Futuristic digital interface displaying data analytics and customer centric marketing elements such as consumer behavior, customer journey and satisfaction metrics.
Futuristic Digital Interface with Real-Time Data Visualization
3D Financial Dashboard Display with Charts and Data Visualization
Digital Financial Dashboard with Global Network Statistics
Global Economic Data Visualization with Dynamic Elements
Digital Dashboard with Blue Charts and Graphs for Data Analysis
Financial Data Interfaces and Digital Analytics Concept
3D Data Visualizations and Graphs on Black Background
Abstract Financial Data Charts in Digital Interface
Premium
Marketer using digital marketing dashboard with charts, pie graphs, organization chart, and performance data. Concept of business analytics and strategic planning.
Premium
Person analyzes social media metrics on laptop screen displaying graphs, charts, icons. Engagement, communication, performance statistics visible on dashboard. Business strategy, data analysis,
Premium
AI data analytics dashboard, business data insights, AI-powered data analysis dashboard, business strategy, Analyst or Scientist uses a computer and dashboard for analysis of information development
Futuristic Blue HUD Interface with Data Visualization Elements
Digital Financial Data Over Global Landscape
Futuristic Data Dashboard with Charts and Analytics
Displaying Futuristic 3D Analytics Dashboard with Network Nodes, Donut Chart and Line Graphs
Financial Data Analysis with Cityscape View: Global Business Concept
Futuristic Analytics Dashboard with Digital Data Visualization
Digital Data Processing with Interactive Graphs and Charts
Abstract Financial Data Visualization Overlaying Office Space
Premium
Team reviewing marketing performance data on large screen in office meeting.
Concept: Marketing analytics, strategy, tracking, teamwork, KPIs, business growth.
Infographic Interface Over Airplane on Runway: Business and Technology Concept
Social Media Analytics Overlay on Urban Street Background
Innovative Finance Analytics Overlaid on Scenic Coastal Landscape
Dynamic Financial Charts and Graphs in Blue Theme
3D Virtual Data Dashboard with Financial Metrics and Social Icons
Statistical Data Analysis on COVID-19 Topics
Dynamic Data with Circuit Patterns and Numerical Sequence
Dynamic Financial Graphs and Charts on Digital Grid Display
Premium
Business analytics and performance indicator dashboard image
Futuristic Digital Analytics Dashboard with Holographic Interface
Futuristic Digital Interface with Data Analytics and Gaming Integration
Digital Interface with Financial Data Charts and Global Connectivity
Abstract Digital Financial Data with Global Connections
Dynamic Numeric Data Streaming on Digital Grid Network
Analyzing Digital Financial Data on Global Scale
Premium
Hand pointing at interactive dashboard with analytics graphs and charts on a large touchscreen display, highlighting data trends and performance metrics in a modern digital workspace.
Global Financial Charts and Digital Data Display
Premium
A collection of business charts and graphs representing data analysis and performance tracking metrics
Statistical Data Visualizations and Renewable Energy Integration
Global Data Trends on Futuristic Digital Interface
Digital Financial Data Visualization Over Dark Background
Social Media Networking Overlayed with Statistical Data Visualization
Premium
Thoughtful man analyzing data on computer screens. Generative AI image
Data Visualization Graphs on Pink Background Illustrating Business Growth
Financial Analytics with Dark Grid and Data Visualizations
Abstract Financial Data Overlay in Modern Office Space
Digital Business Analytics with Data Visualization Elements
Premium
Business analyst working on laptop with holographic dashboard charts and data visualization graphs. Concept of big data, analytics, business intelligence, and financial statistics. crm marketing
Futuristic Global Network Data Interface
Sustainability and Economic Data on Digital Dashboard Interface
Complex Financial Data with Graphs and Digital Interfaces
Graph and Data Processing with Cybersecurity Warnings
Premium
Digital mixed media with businessman observing growth chart. Concept of data driven decisions, performance analysis, business forecasting, and strategic evaluation.
Bitcoin and Data Trends on Digital Grid Background
Futuristic Digital Dashboard with Encryption and Analytics
Dynamic Business Data Visualization with Graphs and Desk
Infographic Overlay on Cityscape Skyview Business Report Interface
Premium
Kpi performance indicators dashboard for business success and strategy management online
Digital Dashboard Display with Varied Data Charts and Metrics
Futuristic Data Analytics Display with Graphs and Charts
Abstract Data Visualization with Numerical Overlay
Digital Data Visualization Interfaces and Infographics
Premium
Faceless advisor financial business analytics woman with data dashboard graphs, female analyst professional, performance metrics review, corporate intelligence work, defocused person, with copy
Interactive Digital Financial Charts Displaying Market Analysis
3D Graphs with Social Media Icons and Analytics Overlays
Data Analytics and Stock Market Trends on Digital Display
Sustainability Icons Over Grid Background Illustrating Eco-Friendly Concepts
Businesswoman Observing Financial Graphs on Virtual Screen
Dynamic Brain Analysis with Data Visualization and Graphs
Analyzing Financial Data with Dynamic Graphs and Charts on Dark Background
Digital Interface with Data Processing Diagrams and Graphs
Digital Data Graphs Over Futuristic Cityscape Concept
Futuristic Cybersecurity Dashboard with Warning Signs and Analytics
Financial Data Charts and Graphs on Blue Digital Background
Futuristic Data Analytics Display with Dynamic Graphs and Charts
Premium
Data Analysis and Reporting. Business professional analyzing financial charts on laptop.
Futuristic Digital Interface with Data Visualization and Notifications
High-Tech Data Processing with Graphs and Charts
Futuristic Digital World Map with Data Analytics Visualization
NFT Floating Over Futuristic Data Visualization Dashboard
Premium
Futuristic e commerce metrics background for retail analytics  dynamic data visualization insights
Digital Financial Chart with Stock Market Data and Analytics
Physician Analyzing Data Hologram in Futuristic Clinic Setting
Dynamic Stock Market Data Visualization on Black Background
Social Media Engagement Data Visualization in 3D Grid Interface
Premium
An analyst uses a computer and dashboard for data business analysis and Data Management System with KPI and metrics connected to the database for technology finance, operations, sales, marketing
Premium
Glowing pulses flowing across data bridge – ideal for tech integration, business intelligence and analytics software platforms
Futuristic Data Analytics Display with Interactive Graphs and Charts
Modern Financial Data Processing Over Landscape Illustration
Futuristic Network with Digital Data Interface for Technology Applications
Digital Data Stream with Binary Code and Charts
Advanced Data Analytics Display with Graphs and Charts in Digital Interface
Digital Financial Data Processing on Abstract Grid Background
Futuristic Data Interface with Network Connections and Analytics
Futuristic Digital Visualization with Neon Wireframe Globe and Analytics
Premium
Modern dashboard real time data tax compliance analytics business intelligence financial report digital interface technology office professional workspace
Explore More Free Stock Images