- Home >
- Stock Photos >
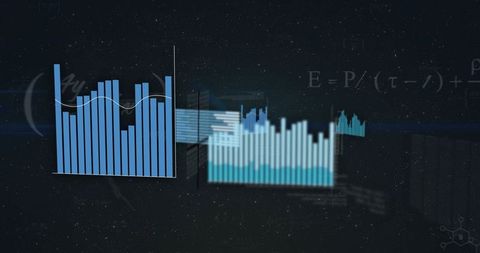
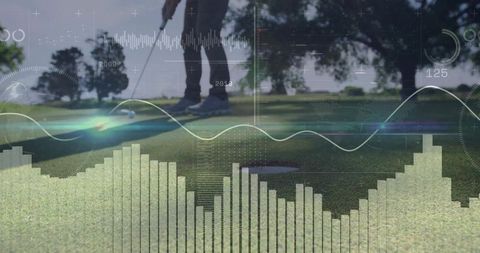
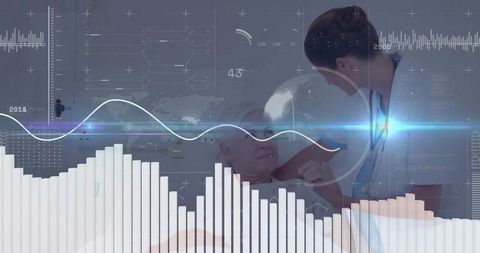
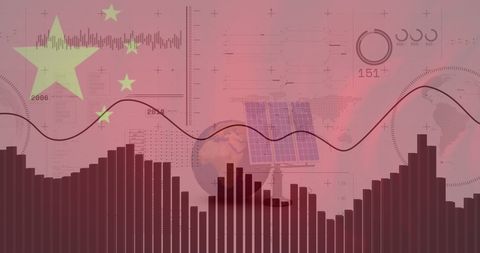
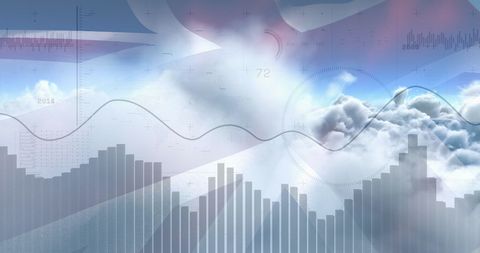
- Futuristic Digital Data Representation with Formulas and Analytics
Futuristic Digital Data Representation with Formulas and Analytics Image
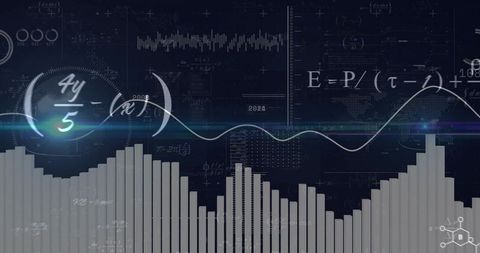
Visual depicting digital data analytics with line and bar graphs overlaid with mathematical formulas on a dark blue background, reflecting technology and research. Useful for articles or websites focused on data analysis technology, futuristic scientific presentation designs, educational tools, financial report covers, or tech-infused dashboard interfaces.

downloads
Tags:
More
Credit Photo
If you would like to credit the Photo, here are some ways you can do so
Text Link
photo Link
<span class="text-link">
<span>
<a target="_blank" href=https://pikwizard.com/photo/futuristic-digital-data-representation-with-formulas-and-analytics/8116dfe37d6832a8c15857801a6ac6d5/>PikWizard</a>
</span>
</span>
<span class="image-link">
<span
style="margin: 0 0 20px 0; display: inline-block; vertical-align: middle; width: 100%;"
>
<a
target="_blank"
href="https://pikwizard.com/photo/futuristic-digital-data-representation-with-formulas-and-analytics/8116dfe37d6832a8c15857801a6ac6d5/"
style="text-decoration: none; font-size: 10px; margin: 0;"
>
<img src="https://pikwizard.com/pw/medium/8116dfe37d6832a8c15857801a6ac6d5.jpg" style="margin: 0; width: 100%;" alt="" />
<p style="font-size: 12px; margin: 0;">PikWizard</p>
</a>
</span>
</span>
Free (free of charge)
Free for personal and commercial use.
Author: Creative Art