
- Home >
- Stock Photos >
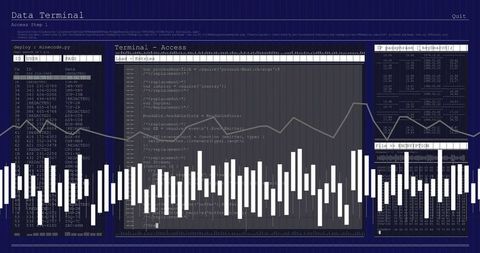
- Futuristic Digital Data Stream with Dynamic Graph Overlay
Futuristic Digital Data Stream with Dynamic Graph Overlay Image

Graphic showcasing fluctuating data in a digital interface, useful for presentations on data analysis or cybersecurity concepts. The image captures both hexadecimal code and network logs, overlayed with dynamic graph line, making it ideal for using in infographics, tech articles, and educational content focused on advanced data processing or cybersecurity. Its monochrome palette enhances the sleek, high-tech feel.
Powered by 


downloads
Tags:
More
Credit Photo
If you would like to credit the Photo, here are some ways you can do so
Text Link
photo Link
<span class="text-link">
<span>
<a target="_blank" href=https://pikwizard.com/photo/futuristic-digital-data-stream-with-dynamic-graph-overlay/1b3fb580a9b9aaf75fbfda287d7dcb58/>PikWizard</a>
</span>
</span>
<span class="image-link">
<span
style="margin: 0 0 20px 0; display: inline-block; vertical-align: middle; width: 100%;"
>
<a
target="_blank"
href="https://pikwizard.com/photo/futuristic-digital-data-stream-with-dynamic-graph-overlay/1b3fb580a9b9aaf75fbfda287d7dcb58/"
style="text-decoration: none; font-size: 10px; margin: 0;"
>
<img src="https://pikwizard.com/pw/medium/1b3fb580a9b9aaf75fbfda287d7dcb58.jpg" style="margin: 0; width: 100%;" alt="" />
<p style="font-size: 12px; margin: 0;">PikWizard</p>
</a>
</span>
</span>
Free (free of charge)
Free for personal and commercial use.
Author: Creative Art
Similar Free Stock Images

Premium


Premium


Premium


Premium


Premium

Premium


Premium


Premium


Premium


Premium

Premium

Premium


Premium


Premium


Premium


Premium


Premium


Premium

Premium


Premium


Premium


Premium


Premium


Premium


Premium

Explore More Free Stock Images