
- Home >
- Stock Photos >
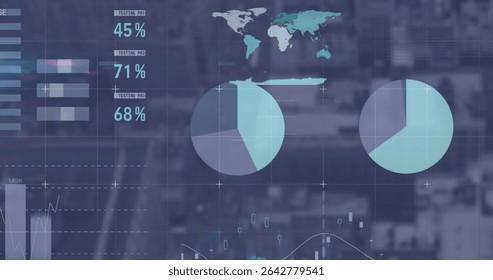
- Futuristic Digital Data Visualization with Graph and Pie Chart
Futuristic Digital Data Visualization with Graph and Pie Chart Image

This image depicts a modern interface displaying advanced data visualization such as a pie chart and bar graph against a dark background. It represents the global connection of information via sophisticated computing systems. Ideal for use in technology blogs, financial analyses, or articles about digital transformation, this image communicates the sophistication of data processing tools in today's world.
Powered by  - Get 15% off with code: PIKWIZARD15


downloads
Tags:
More
Credit Photo
If you would like to credit the Photo, here are some ways you can do so
Text Link
photo Link
<span class="text-link">
<span>
<a target="_blank" href=https://pikwizard.com/photo/futuristic-digital-data-visualization-with-graph-and-pie-chart/00f62de7ed49faf8aa90a48ddf350958/>PikWizard</a>
</span>
</span>
<span class="image-link">
<span
style="margin: 0 0 20px 0; display: inline-block; vertical-align: middle; width: 100%;"
>
<a
target="_blank"
href="https://pikwizard.com/photo/futuristic-digital-data-visualization-with-graph-and-pie-chart/00f62de7ed49faf8aa90a48ddf350958/"
style="text-decoration: none; font-size: 10px; margin: 0;"
>
<img src="https://pikwizard.com/pw/medium/00f62de7ed49faf8aa90a48ddf350958.jpg" style="margin: 0; width: 100%;" alt="" />
<p style="font-size: 12px; margin: 0;">PikWizard</p>
</a>
</span>
</span>
Free (free of charge)
Free for personal and commercial use.
Author: People Creations
Similar Free Stock Images

Premium


Premium

Premium


Premium


Premium


Premium


Premium


Premium


Premium

Premium

Premium


Premium


Premium


Premium


Premium


Premium


Premium


Premium


Premium


Premium


Premium


Premium


Premium


Premium


Premium

Explore More Free Stock Images