- Home >
- Stock Photos >
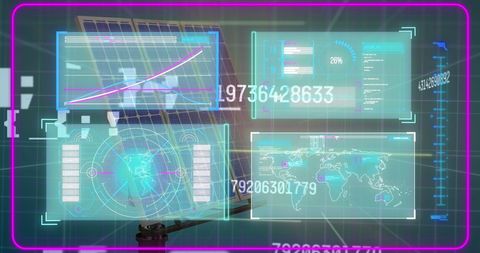
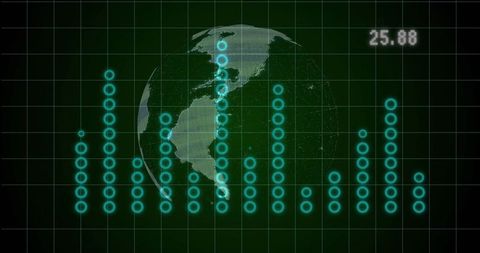
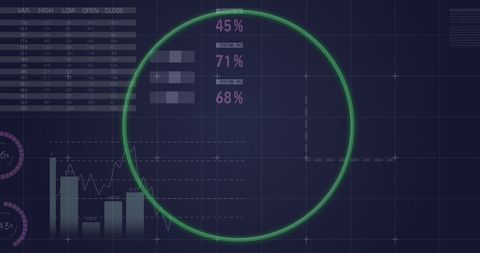
- Futuristic Digital Data Visualization with Interactive Graphs
Futuristic Digital Data Visualization with Interactive Graphs Image

This visual showcases a high-tech digital interface with graphs and charts displayed overlaid on a world map. The upor Warp effect gives a sense of dynamic data interaction, suitable for presentations on global technology trends, analytics, financial markets, or innovative systems in technological applications. Useful for illustrating concepts in finance technology, data analysis tools, or global business strategies.

downloads
Tags:
More
Credit Photo
If you would like to credit the Photo, here are some ways you can do so
Text Link
photo Link
<span class="text-link">
<span>
<a target="_blank" href=https://pikwizard.com/photo/futuristic-digital-data-visualization-with-interactive-graphs/2bd6fae9e8864729febcd65ec8a029be/>PikWizard</a>
</span>
</span>
<span class="image-link">
<span
style="margin: 0 0 20px 0; display: inline-block; vertical-align: middle; width: 100%;"
>
<a
target="_blank"
href="https://pikwizard.com/photo/futuristic-digital-data-visualization-with-interactive-graphs/2bd6fae9e8864729febcd65ec8a029be/"
style="text-decoration: none; font-size: 10px; margin: 0;"
>
<img src="https://pikwizard.com/pw/medium/2bd6fae9e8864729febcd65ec8a029be.jpg" style="margin: 0; width: 100%;" alt="" />
<p style="font-size: 12px; margin: 0;">PikWizard</p>
</a>
</span>
</span>
Free (free of charge)
Free for personal and commercial use.
Author: People Creations