
- Home >
- Stock Photos >
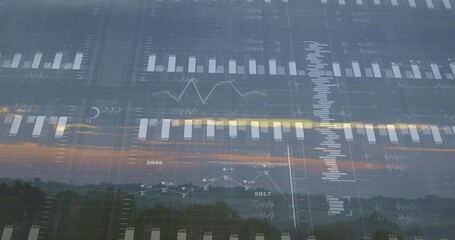
- Futuristic Digital Data Visualization with Line Chart and Globe
Futuristic Digital Data Visualization with Line Chart and Globe Image

Digital visualization showcases a neon green line chart overlaying a globe with colorful points, representing data flow and analysis. Suitable for use in technology or finance-related content about data analytics, innovative dashboards, or futuristic visual interpretations.
Powered by 


downloads
Tags:
More
Credit Photo
If you would like to credit the Photo, here are some ways you can do so
Text Link
photo Link
<span class="text-link">
<span>
<a target="_blank" href=https://pikwizard.com/photo/futuristic-digital-data-visualization-with-line-chart-and-globe/6337499757c4564c5312e265fa3c4917/>PikWizard</a>
</span>
</span>
<span class="image-link">
<span
style="margin: 0 0 20px 0; display: inline-block; vertical-align: middle; width: 100%;"
>
<a
target="_blank"
href="https://pikwizard.com/photo/futuristic-digital-data-visualization-with-line-chart-and-globe/6337499757c4564c5312e265fa3c4917/"
style="text-decoration: none; font-size: 10px; margin: 0;"
>
<img src="https://pikwizard.com/pw/medium/6337499757c4564c5312e265fa3c4917.jpg" style="margin: 0; width: 100%;" alt="" />
<p style="font-size: 12px; margin: 0;">PikWizard</p>
</a>
</span>
</span>
Free (free of charge)
Free for personal and commercial use.
Author: Authentic Images
Similar Free Stock Images

Premium


Premium

Premium


Premium


Premium


Premium

Premium


Premium

Premium


Premium


Premium


Premium

Premium

Premium


Premium

Premium


Premium


Premium


Premium


Premium


Premium


Premium


Premium


Premium

Premium


Explore More Free Stock Images