
- Home >
- Stock Photos >
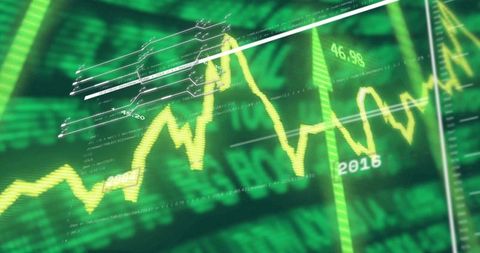
- Futuristic Digital Finance Chart With Green Data Visualization
Futuristic Digital Finance Chart With Green Data Visualization Image

This image illustrates a futuristic depiction of financial trends with green color highlighting upward movements and data activity. Ideal for usage in financial reports, investment presentations, technology magazines, or websites explaining financial analytics and data-mining solutions.
Powered by  - Get 15% off with code: PIKWIZARD15


downloads
Tags:
More
Credit Photo
If you would like to credit the Photo, here are some ways you can do so
Text Link
photo Link
<span class="text-link">
<span>
<a target="_blank" href=https://pikwizard.com/photo/futuristic-digital-finance-chart-with-green-data-visualization/71a01a550bb1e11fc1f6873333aaf7fa/>PikWizard</a>
</span>
</span>
<span class="image-link">
<span
style="margin: 0 0 20px 0; display: inline-block; vertical-align: middle; width: 100%;"
>
<a
target="_blank"
href="https://pikwizard.com/photo/futuristic-digital-finance-chart-with-green-data-visualization/71a01a550bb1e11fc1f6873333aaf7fa/"
style="text-decoration: none; font-size: 10px; margin: 0;"
>
<img src="https://pikwizard.com/pw/medium/71a01a550bb1e11fc1f6873333aaf7fa.jpg" style="margin: 0; width: 100%;" alt="" />
<p style="font-size: 12px; margin: 0;">PikWizard</p>
</a>
</span>
</span>
Free (free of charge)
Free for personal and commercial use.
Author: Awesome Content
Similar Free Stock Images

Premium


Premium

Premium


Premium


Premium

Premium


Premium


Premium


Premium


Premium


Premium


Premium


Premium


Premium


Premium


Premium


Premium


Premium


Premium

Premium


Premium


Premium


Premium


Premium


Premium


Explore More Free Stock Images