- Home >
- Stock Photos >
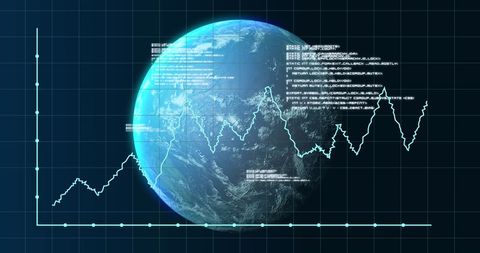
- Futuristic Digital Finance World Map with Dynamic Data
Futuristic Digital Finance World Map with Dynamic Data Image

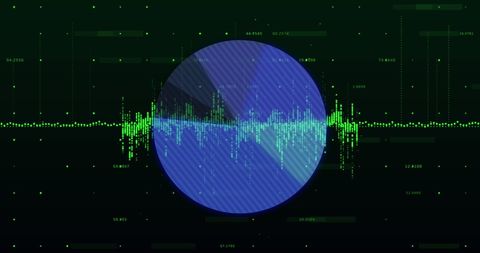
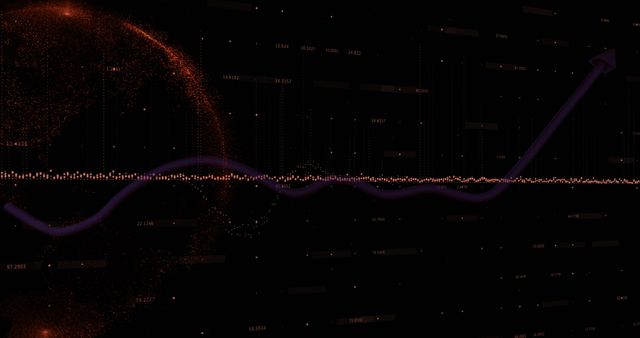
Visual depiction of global financial data and statistics, represented through digital graphics and charts on a green screen. Shows figures, statistical analysis, and a world map, creating a feeling of advanced technology and futurism. Ideal for presentations on finance, stock market trends, economic forecasts, and data visualization solutions.

downloads
Tags:
More
Credit Photo
If you would like to credit the Photo, here are some ways you can do so
Text Link
photo Link
<span class="text-link">
<span>
<a target="_blank" href=https://pikwizard.com/photo/futuristic-digital-finance-world-map-with-dynamic-data/1aeb03d7633d2834ffc93fc5495572ae/>PikWizard</a>
</span>
</span>
<span class="image-link">
<span
style="margin: 0 0 20px 0; display: inline-block; vertical-align: middle; width: 100%;"
>
<a
target="_blank"
href="https://pikwizard.com/photo/futuristic-digital-finance-world-map-with-dynamic-data/1aeb03d7633d2834ffc93fc5495572ae/"
style="text-decoration: none; font-size: 10px; margin: 0;"
>
<img src="https://pikwizard.com/pw/medium/1aeb03d7633d2834ffc93fc5495572ae.jpg" style="margin: 0; width: 100%;" alt="" />
<p style="font-size: 12px; margin: 0;">PikWizard</p>
</a>
</span>
</span>
Free (free of charge)
Free for personal and commercial use.
Author: Awesome Content