- Home >
- Stock Photos >
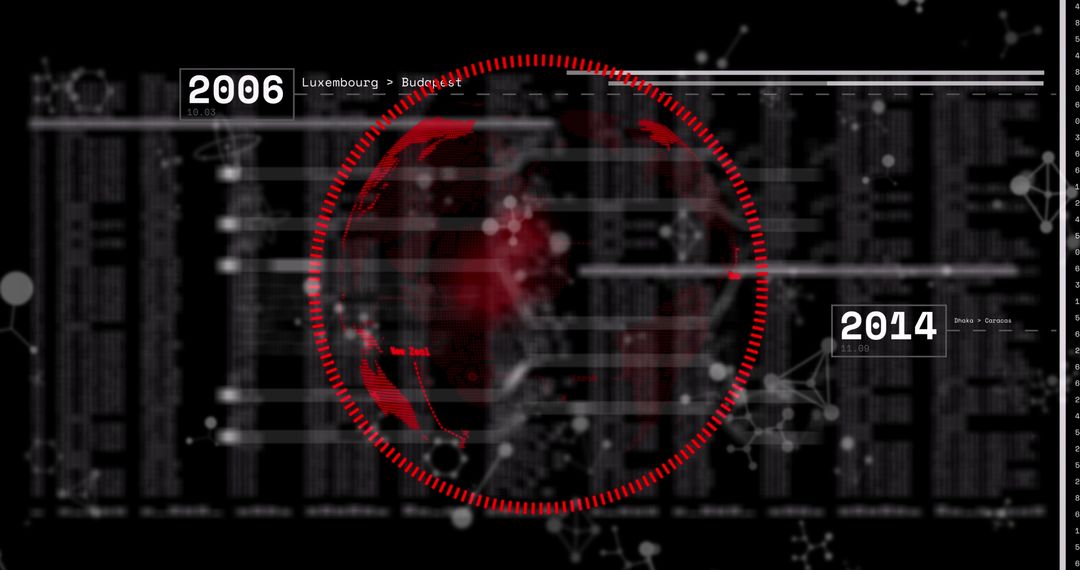
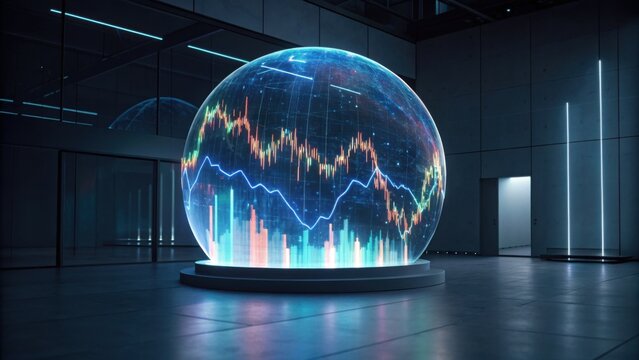
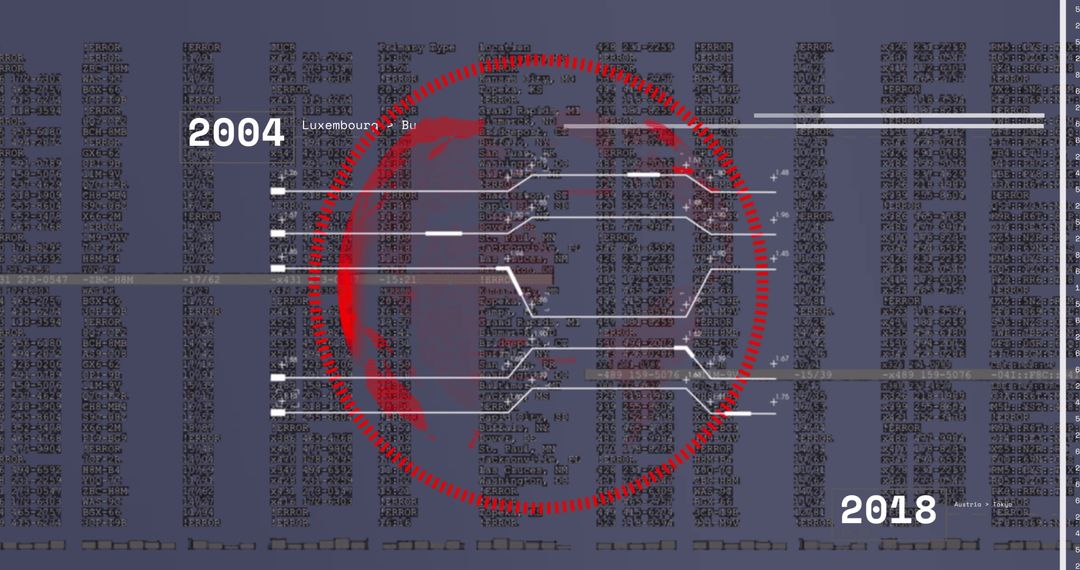
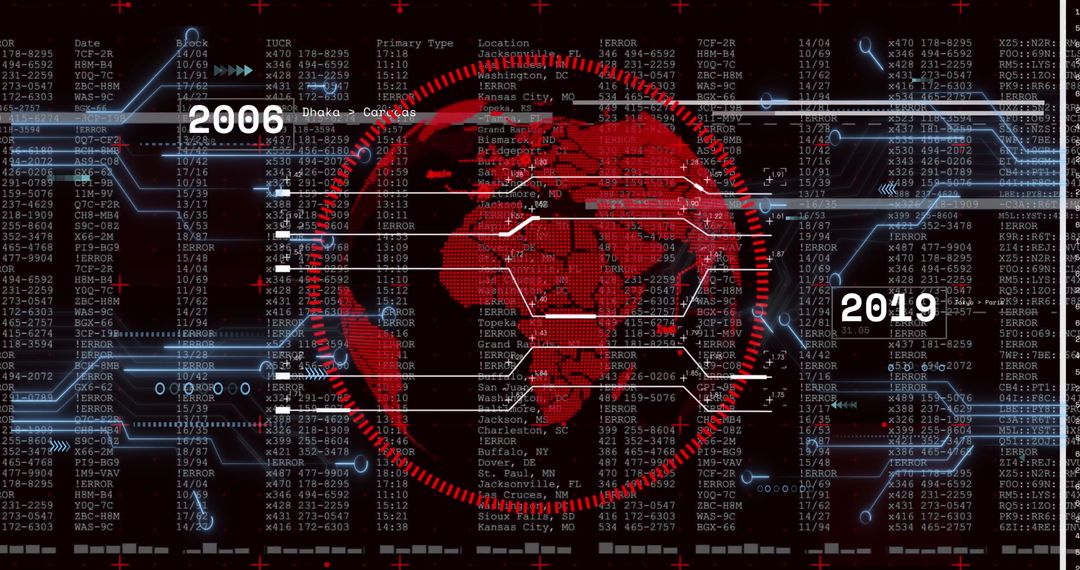
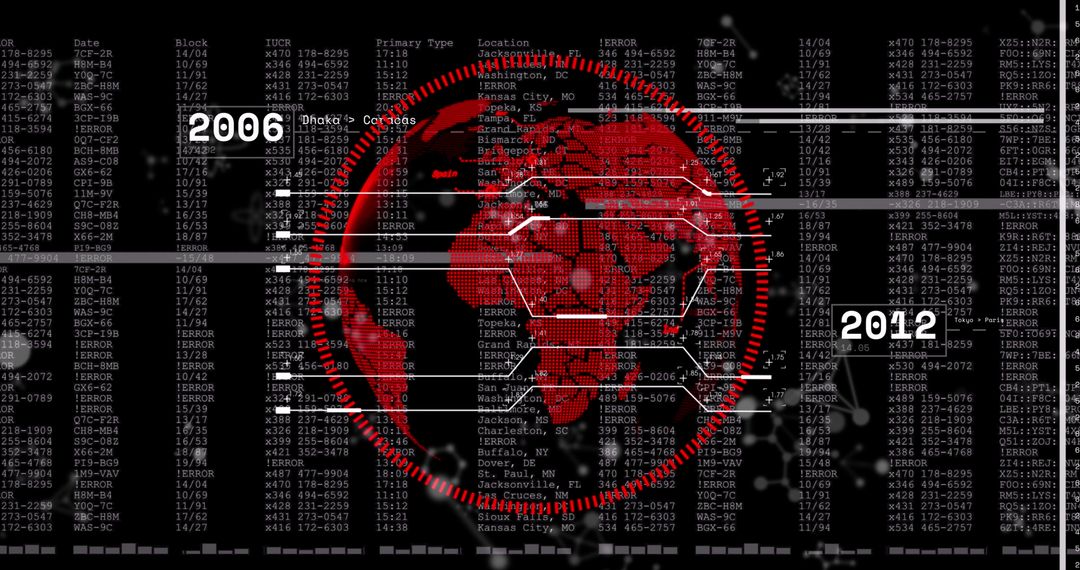
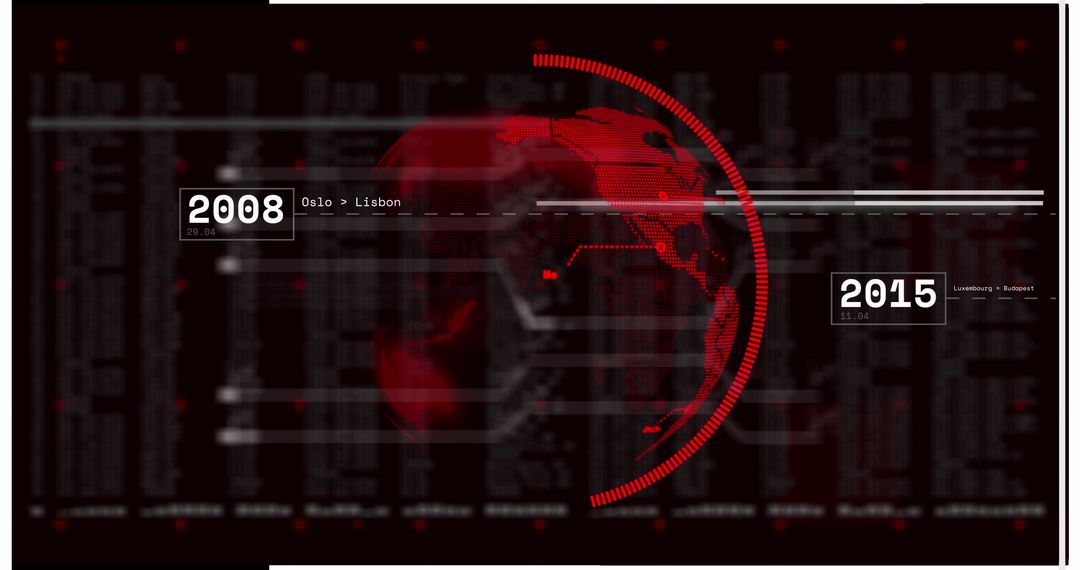
- Futuristic Digital Globe with Data Metrics and Timeline
Futuristic Digital Globe with Data Metrics and Timeline Image

Red digital globe on dark background with data and timelines evocative of science fiction. Perfect for illustrating concepts of futurology, data analysis, cyber technology, and global networks. Ideal for tech websites, innovation presentations, data visualization projects, or as background for technology-themed events or publications.
Powered by 


0
downloads
downloads
Tags:
More
Credit Photo
If you would like to credit the Photo, here are some ways you can do so
Text Link
photo Link
<span class="text-link">
<span>
<a target="_blank" href=https://pikwizard.com/photo/futuristic-digital-globe-with-data-metrics-and-timeline/463c93bf5e07678992065b60c79ddee7/>PikWizard</a>
</span>
</span>
<span class="image-link">
<span
style="margin: 0 0 20px 0; display: inline-block; vertical-align: middle; width: 100%;"
>
<a
target="_blank"
href="https://pikwizard.com/photo/futuristic-digital-globe-with-data-metrics-and-timeline/463c93bf5e07678992065b60c79ddee7/"
style="text-decoration: none; font-size: 10px; margin: 0;"
>
<img src="https://pikwizard.com/pw/medium/463c93bf5e07678992065b60c79ddee7.jpg" style="margin: 0; width: 100%;" alt="" />
<p style="font-size: 12px; margin: 0;">PikWizard</p>
</a>
</span>
</span>
Free (free of charge)
Free for personal and commercial use.
Author: Authentic Images
Similar Free Stock Images
Premium


Premium


Premium


Premium


Premium


Premium


Premium


Premium


Premium


Premium


Premium


Premium


Premium


Premium


Premium


Premium


Premium


Premium


Premium


Premium


Premium


Premium


Premium


Premium