- Home >
- Stock Photos >
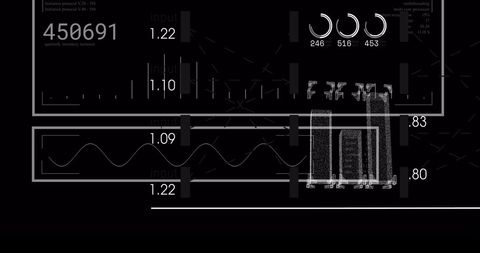
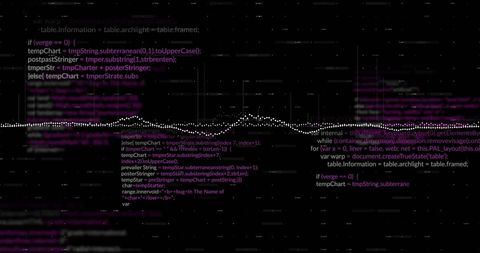
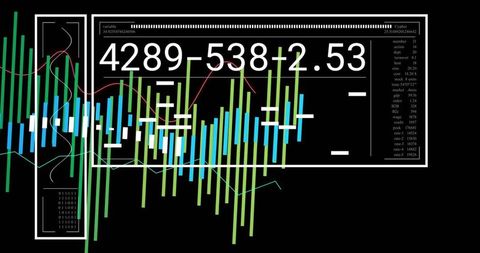
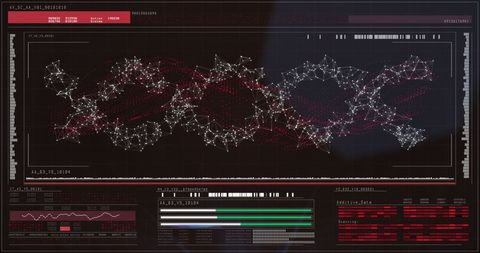
- Futuristic Digital Graph with Dynamic Data Visualization
Futuristic Digital Graph with Dynamic Data Visualization Image

Depicts digital graphs and numbers against a dark background, reflecting a futuristic business and technology theme. Ideal for representing data analysis, financial reports, or information technology advancements in presentations, websites, or articles focusing on business growth and technology innovation.

downloads
Tags:
More
Credit Photo
If you would like to credit the Photo, here are some ways you can do so
Text Link
photo Link
<span class="text-link">
<span>
<a target="_blank" href=https://pikwizard.com/photo/futuristic-digital-graph-with-dynamic-data-visualization/7ea57b0def793171b06543fe997eca1e/>PikWizard</a>
</span>
</span>
<span class="image-link">
<span
style="margin: 0 0 20px 0; display: inline-block; vertical-align: middle; width: 100%;"
>
<a
target="_blank"
href="https://pikwizard.com/photo/futuristic-digital-graph-with-dynamic-data-visualization/7ea57b0def793171b06543fe997eca1e/"
style="text-decoration: none; font-size: 10px; margin: 0;"
>
<img src="https://pikwizard.com/pw/medium/7ea57b0def793171b06543fe997eca1e.jpg" style="margin: 0; width: 100%;" alt="" />
<p style="font-size: 12px; margin: 0;">PikWizard</p>
</a>
</span>
</span>
Free (free of charge)
Free for personal and commercial use.
Author: Creative Art