
- Home >
- Stock Photos >
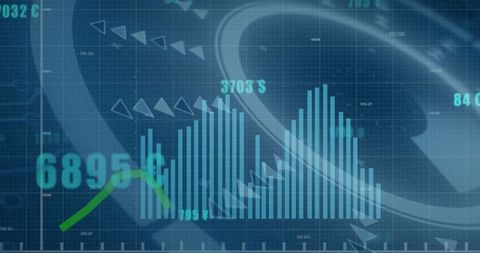
- Futuristic Digital Graph with Glitch Effect for Data Analysis
Futuristic Digital Graph with Glitch Effect for Data Analysis Image

Bright, dynamic graphic ideal for conveying themes of technology and futuristic data analysis. It can enhance presentations, reports, or websites focused on business or financial tech solutions, machine learning, or modern analytical tools.
Powered by 


downloads
Tags:
More
Credit Photo
If you would like to credit the Photo, here are some ways you can do so
Text Link
photo Link
<span class="text-link">
<span>
<a target="_blank" href=https://pikwizard.com/photo/futuristic-digital-graph-with-glitch-effect-for-data-analysis/472094c8bd2e39b11fad913f1f4a0068/>PikWizard</a>
</span>
</span>
<span class="image-link">
<span
style="margin: 0 0 20px 0; display: inline-block; vertical-align: middle; width: 100%;"
>
<a
target="_blank"
href="https://pikwizard.com/photo/futuristic-digital-graph-with-glitch-effect-for-data-analysis/472094c8bd2e39b11fad913f1f4a0068/"
style="text-decoration: none; font-size: 10px; margin: 0;"
>
<img src="https://pikwizard.com/pw/medium/472094c8bd2e39b11fad913f1f4a0068.jpg" style="margin: 0; width: 100%;" alt="" />
<p style="font-size: 12px; margin: 0;">PikWizard</p>
</a>
</span>
</span>
Free (free of charge)
Free for personal and commercial use.
Author: Awesome Content
Similar Free Stock Images

Premium


Premium

Premium


Premium


Premium


Premium


Premium


Premium

Premium


Premium


Explore More Free Stock Images