- Home >
- Stock Photos >
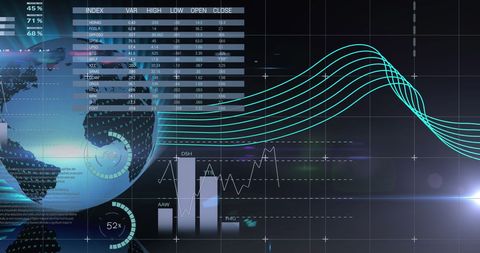
- Futuristic Digital Graphs and Data Visualization Interface
Futuristic Digital Graphs and Data Visualization Interface Image

The virtual presentation highlights various types of data visualization tools including bar charts, waveforms, and radial graphs. It symbolizes modern analytical methods, frequently used in technological hubs, analysis reports, and futuristic movie themes. It suits materfocused rubusiness contexts, educational tool previews, or as background for presentations engaging automation and innovation themes.

downloads
Tags:
More
Credit Photo
If you would like to credit the Photo, here are some ways you can do so
Text Link
photo Link
<span class="text-link">
<span>
<a target="_blank" href=https://pikwizard.com/photo/futuristic-digital-graphs-and-data-visualization-interface/4c43aae19e094097ba55732470c0cdbe/>PikWizard</a>
</span>
</span>
<span class="image-link">
<span
style="margin: 0 0 20px 0; display: inline-block; vertical-align: middle; width: 100%;"
>
<a
target="_blank"
href="https://pikwizard.com/photo/futuristic-digital-graphs-and-data-visualization-interface/4c43aae19e094097ba55732470c0cdbe/"
style="text-decoration: none; font-size: 10px; margin: 0;"
>
<img src="https://pikwizard.com/pw/medium/4c43aae19e094097ba55732470c0cdbe.jpg" style="margin: 0; width: 100%;" alt="" />
<p style="font-size: 12px; margin: 0;">PikWizard</p>
</a>
</span>
</span>
Free (free of charge)
Free for personal and commercial use.
Author: Creative Art