- Home >
- Stock Photos >
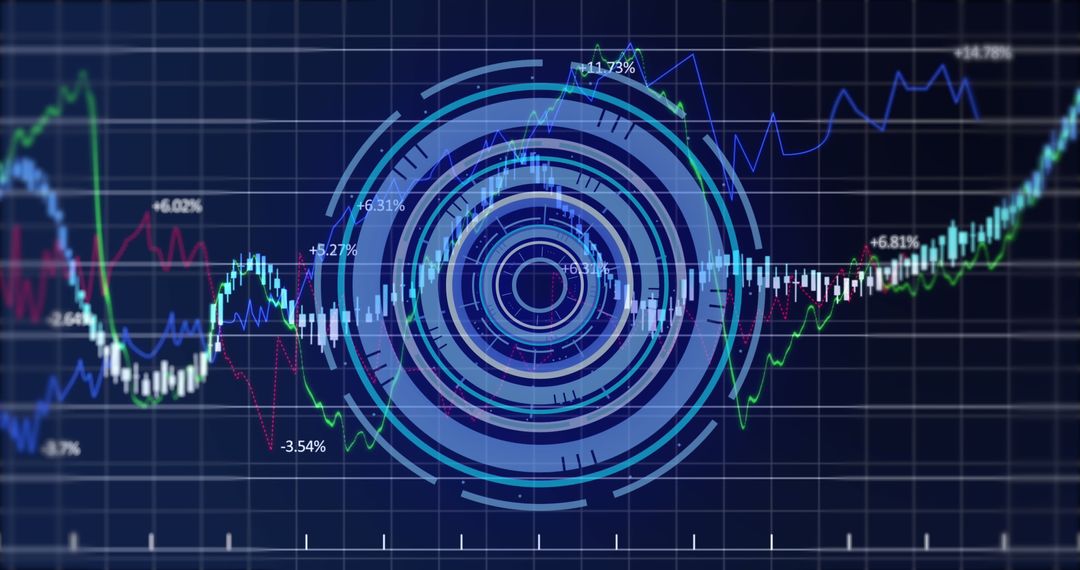
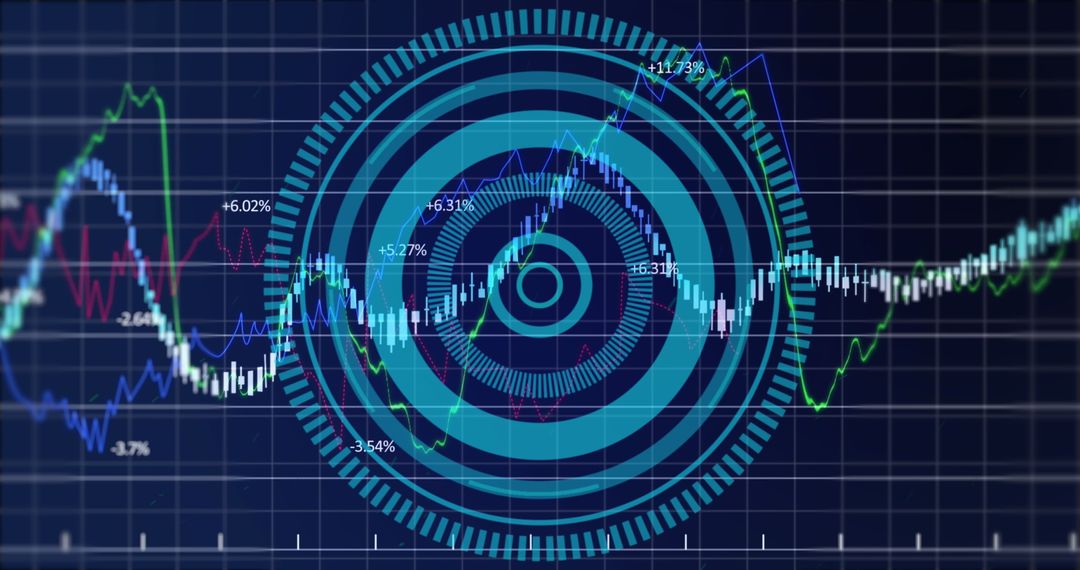
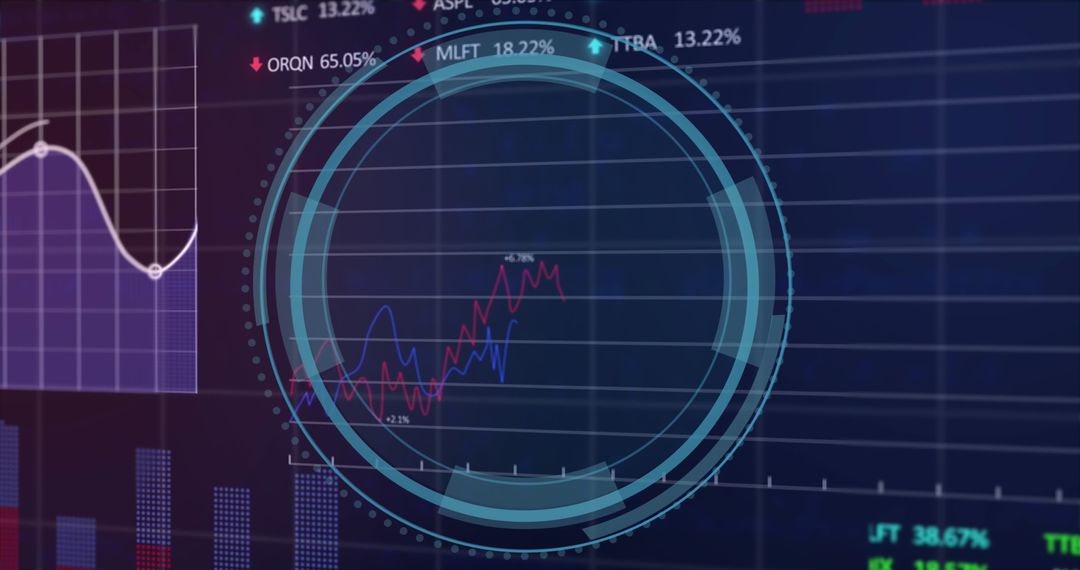
- Futuristic Digital Interface Analyzing Stock Market Trends
Futuristic Digital Interface Analyzing Stock Market Trends Image

The visual shows a round scanner overlay on digital stock market data with various financial graphs and charts. Perfect for illustrating concepts in finance, global economy analysis, business statistics, and the integration of advanced technology in trading systems. Ideal for financial service presentations, economic forecasts, and tech-driven blog content.
Powered by  - Get 15% off with code: PIKWIZARD15


2
downloads
downloads
Tags:
More
Credit Photo
If you would like to credit the Photo, here are some ways you can do so
Text Link
photo Link
<span class="text-link">
<span>
<a target="_blank" href=https://pikwizard.com/photo/futuristic-digital-interface-analyzing-stock-market-trends/772253fc9dc4d62d4e61c6c0fb76f738/>PikWizard</a>
</span>
</span>
<span class="image-link">
<span
style="margin: 0 0 20px 0; display: inline-block; vertical-align: middle; width: 100%;"
>
<a
target="_blank"
href="https://pikwizard.com/photo/futuristic-digital-interface-analyzing-stock-market-trends/772253fc9dc4d62d4e61c6c0fb76f738/"
style="text-decoration: none; font-size: 10px; margin: 0;"
>
<img src="https://pikwizard.com/pw/medium/772253fc9dc4d62d4e61c6c0fb76f738.jpg" style="margin: 0; width: 100%;" alt="" />
<p style="font-size: 12px; margin: 0;">PikWizard</p>
</a>
</span>
</span>
Free (free of charge)
Free for personal and commercial use.
Author: Creative Art
Similar Free Stock Images

Premium


Premium


Premium


Premium


Premium


Premium


Premium


Premium


Premium


Premium


Premium


Premium


Premium


Premium


Premium


Premium


Premium


Premium


Premium


Premium


Premium


Premium


Premium


Premium